Application-Specific Characterizations And Analyses Of Carbon-Based Materials
- 31 Jan 2021
- Volume 21
- NANOscientific Magazine, Winter 2021
Manoj Aravind Sankar1*, Prasanna Ram2
1University of California Los Angeles, Los Angeles, California 90095, United States of America 2Vel Tech Rangarajan Dr.Sagunthala R&D Institute of Science and Technology, Avadi, Chennai, Tamil Nadu 600062, India *Corresponding author: manoj1508.aravind@outlook.com
Abstract
Carbon-based materials are being used increasingly in various applications recently. This is primarily attributed to their customizable nature and multiple allotropes. Carbon could be sourced naturally as well as produced by synthetic methods for the further processing steps into customized forms such as sheets, wires, quantum dots, powder, granules, pellets, rods, tubes, composites, etc. From the viewpoint of the system working cycle, behavioral characterizations are essential to substantiate the applicability of a material. Several analytical and characterization techniques are effectively put into use towards qualitative as well as quantitative estimation, measurement, and verification. In this study, powdered activated charcoal (activated carbon), lampblack (carbon black), and powdered graphene (graphene) are subjected to investigations such as x-ray diffraction (XRD), light microscopy (LM), scanning electron microscopy (SEM), infrared (IR) thermal imaging, electrical probing (Ω), and chemical sampling, and the observations are assessed and correlated with pertinent applications.
Introduction
Carbon exists abundantly in various forms which could be acquired, synthesized, and tailored towards their interesting physicochemical, thermal, mechanical, electrical, magnetic, and optical properties. The current study attempts to underline the efficacy of various characterization methods and relate them to carbon’s appositeness in multifaceted applications [1,2,3,4].
Materials and Methods
Lampblack is synthesized from Panchadeepa oil, a heterogeneous lipid constituted by ghee and plant oils, subjected to incomplete combustion and vapor-deposition upon copper. Activated charcoal (medicinal grade) was procured from HealthVit. Industrial-grade graphite was acquired and exfoliated into graphene. Tetrahydrofuran (THF), Dimethylformamide (DMF), and distilled water (AR/ACS) were sourced from the Organic Chemistry Laboratory, Veltech Research Park. Indian Pharmacopoeia grade paraffinum liquidum was obtained from Tudor Laboratories [5]. XRD scan was conducted on Bruker instrument with copper anode, K????1 = 1.5406 Å, K????2 = 1.5444 Å along the goniophotometer axis from 100 - 900 for every 0.020, and analyzed on OriginLab.
Eastcolight HK Micro-Science light microscope was used to capture light micrographs of the carbon materials placed on a microscope slide, with 600-1200x magnification. After image optimization, photos were taken using Xiaomi Redmi Note 3 Pro smartphone equipped with 16 MP and phase-detection autofocus. Image post-processing was done using LunaPic.
SEM was performed with Tescan VEGA 3SBH at an accelerating voltage of 15 kV, working distance 15.16-15.62 mm. After adjusting the optimized image, magnification, average view field, and resolution were set to 1kx, 126.5 µm, and 20 µm, respectively. Carbon samples were refrigerated at 277K, and then thermal imaging was done using Fluke Ti100 IR Camera. The IR images were interpreted on Fluke SmartView IR Analysis Reporting Software [5].
Electrical resistances of the carbons in liquid paraffin were measured using Crenova MS8233D Multimeter [5]. For testing solubility, 5 mg of each solute was mixed in 100 mL of each solvent - water, 90% THF, 90% DMF, and IP liquid
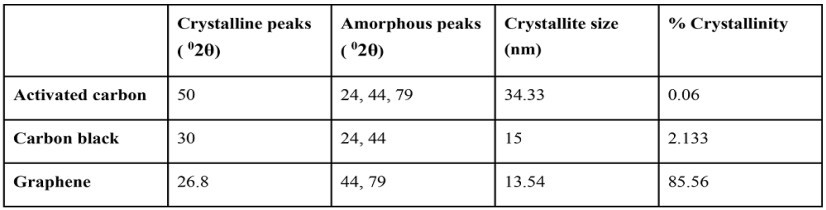
Table I. XRD Peak Analysis
Results and Analyses
XRD of carbon materials corroborates the crystalline nature. From Table I, it is deduced that the % crystallinity in Graphene >>> Carbon black > Activated carbon. The crystallite size of carbons is in accordance with the amorphousness, i.e., Activated carbon > Carbon black > Graphene.
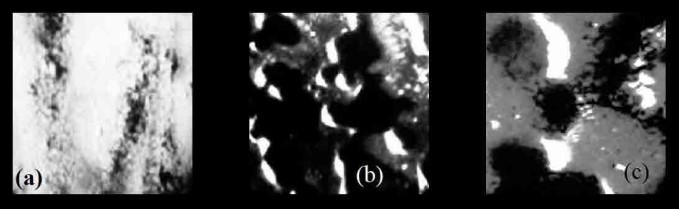
Figure 1. Light micrographs of a) Activated carbon, b) Carbon black, c) Graphene.
LM resolution limits its depth of analysis, and hence, properties such as particle size distribution, porosity, surface topography cannot be quantified to a large extent. From Figure 1, the morphology is very uniform for Graphene > Activated carbon > Carbon black. Carbon black spreads erratically, forming layers and shadows in imaging. Activated carbon and carbon black have a higher surface area than graphene since, for an equivalent quantity, graphene is less scattered. Powdery form yields a more pronounced airgap in activated charcoal [5].
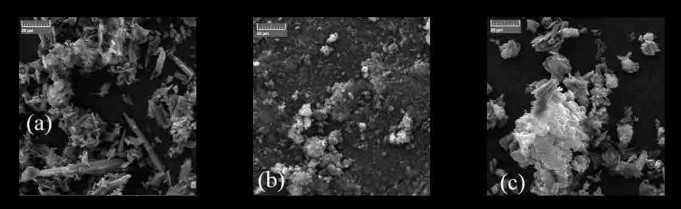
Figure 2. Scanning electron micrographs of a) Activated carbon, b) Carbon black, c) Graphene.
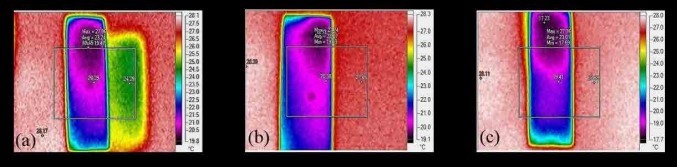
Figure 3. FLIR of microscopic glass slides with a) Activated carbon, b) Carbon black, c) Graphene [5].
SEM images in Figure 2 offer more quantifiable and scalable data than LM. Secondary electron detectors demonstrate topographical variations - clustery porous activated carbon and carbon black, and fractal periodic flaky graphene. Graphene and activated carbon have voids, whereas carbon black consists of agglomerates. Backscattered electron detectors construe the elemental composition as image contrast, and the carbonaceousness in Graphene > Activated carbon > Carbon black. The forward-looking infrared images in Figure 3 indicate a uniform temperature distribution across carbon black and graphene. However, activated carbon coated glass slide exhibits two different temperature distributions, the other distribution being congruent in dimensions but differing by an average temperature of +5K at a distance throughout. This might be due to the amorphous nature of activated carbon and phonon scattering. The images in Figure 4 correspond to those in Figure 3, with the former being a three-dimensional representation of the latter.
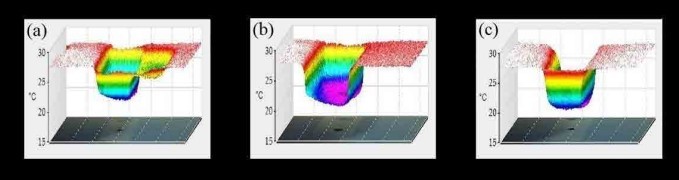
Figure 4. 3DIR graphs of liquid paraffin dispersed with a) Activated carbon, b) Carbon black, c) Graphene [5]
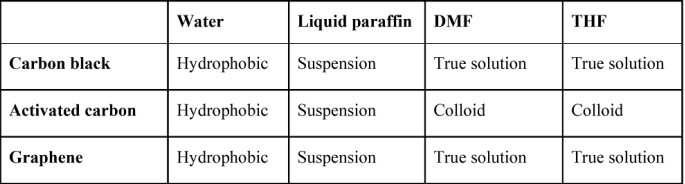
Table II. Solubilities of carbons in different solvents
The plane into the paper/screen corresponds to the two-dimensional surface of the carbon-coated glass slide, and the normal axis to it represents the temperature variation map. Graphene and activated carbon exhibit a nearsymmetrical heat flux profile. Activated carbon exhibits an enclosed heat variation with the outward heat flux getting flattened, whereas graphene exhibits a similar variation with the heat flux curving outwards in a continuous fashion as it stems from the inward. The heat flux from carbon black is distorted and is asymmetrical.

Table III. Ohmic measurements [5] Resistances in Table III indicate that electrical conductivity of Graphene >> Carbon black > Activated carbon.
Solute-solvent molecular interactions vary based on miscibility, homogeneity, and affinity of materials. All carbons repelled water molecules, floating on water in spite of repeated stirring. The three carbons are heterogeneous in liquid paraffin, forming a suspension. Carbon black, after ultrasonication in THF, and graphene exhibit homogeneity with DMF and THF. Activated carbon is averse to THF and DMF. Despite molecular agitation by ultrasonic waves thrice, it exhibited only partial solubility. The observations are briefed in Table II.
Discussion
Material crystallinity, the fundamental of solid-state physics [6], is perceptible from XRD results yielded in Table I. Paramount insights into the morphology, surface topography, stacking, and carbon composition were obtained from the micrographs in Figures 1 and 2, which could be applied in interfacial surface tension in antenna coating [7], platelet formation in layered-printing [8], and conductive filling in voids of ultracapacitor electrode [9]. From Figures 3 and 4, the thermal flux and superficial heat distribution of carbons after cooling were understood, and these would be crucial in passive cooling [10], adsorptive chillers [11], and nanoscale Joule heating [12]. Tangible findings on solute-solvent interactions in Table II furnish helpful observables from the perspectives of industrial pigments, paints, and dyes, and tailoring PEM fuel cell catalyst support towards overcoming platinum catalyst poisoning by hydrophobicity [13]. Electrical resistance measurements would prove nifty in graphene antennas [14] and conductive carbon blacks [15].
Conclusion and Future Scope
In the present work, observations from XRD, LM, SEM, IR imaging, solubility, and Ω were scrutinized and related to carbon applications. The outcomes and impact could be furthered by conducting other analyses such as TEM, AFM, EDX, Raman spectroscopy, ICP-OES, NMR, TGA, BJH-BET, and molecular dynamics for cumulative supplementation.
Acknowledgment
The authors are grateful to Dr. N.G. Renganathan for his valuable guidance. The authors acknowledge Dr. Gowthaman Swaminathan, Dr. Radhakrishnan Narayanaswamy, Dr. Rameshkumar Chidambaram – former in-charge professors of laboratories, Veltech Research Park (Former Director R&D), and Dr. P. Periasamy and Mr. N. Karunanithi - CSIR CECRI ICP Section Karaikudi for extending their instrumentation and services.
Disclosures
Figures 3 and 4, and Table III are adapted with permission from Ram, P., Sankar, M. A., & Renganathan, N. G. (2019). Studies on Carbon MaterialsBased Antenna for Space Applications. In Innovative Design, Analysis, and Development Practices in Aerospace and Automotive Engineering (I-DAD 2018) (pp. 311-329). Springer, Singapore. Copyright 2019 Springer Nature (License #4956790778490).
References
1. https://doi.org/10.1023/ B:JMSC.0000021439.18202.ea
2. https://www.elsevier.com/ books/handbook-of-carbongraphite-diamonds-and-fullerenes/ pierson/978-0-8155-1339-1.
3. https://doi.org/10.1002/smll.201102635
4. https://doi.org/10.1002/ adma.201290269
5. https://doi.org/10.1007/978-981-13- 2718-6_29
6. https://doi.org/10.1017/ CBO9781139167871
7. https://doi.org/10.1109/ TMTT.2011.2164093
8. https://doi.org/10.1038/srep17707
9. https://doi.org/10.1016/j. carbon.2018.03.001
10. https://doi.org/10.1016/j. applthermaleng.2016.03.161
11. https://doi.org/10.1016/j. apenergy.2013.11.073
12. https://doi.org/10.1038/ nnano.2011.39
13. https://doi.org/10.3390/nano7020031
14. https://arxiv.org/abs/1704.00371v2
15. https://doi.org/10.1016/j. jpowsour.2017.02.056
