Textile Nanocharacterization: Topography, Phase Imaging, and NanomechanicalProperty Investigation of Polyester Yarn Interaction with Silicon Matrix
- 26 Sep 2016
- Volume 8
- NanoScientific Magazine, Fall 2016
By Gerald Pascual, Byong Kim, Mina Hong, John Paul Pineda, and Keibock Lee Technical Marketing, Park Systems Inc., Santa Clara, CA, USA
ABSTRACT
Textiles research and development is rapidly turning to nanomaterials to create new fabric blends that have increased performance for traits such as damage resistance, breathability, and even self-cleaning. To better inform materials design strategies, it is necessary to have a tool and techniques capable of measuring not onlynanoscale topographies of material components, but their nanomechanical properties as well. Atomic Force Microscopy (AFM) is a solution well-suited to explore and characterize these traits. To this end, a silicon gel matrix and polyester yarn sample was prepared for examination with a commercial AFM system, the Park NX10 from Park Systems. Non-contact mode AFM from Park Systems was used to perform topography and phase imaging. Force-distance spectroscopy plus force-volume mapping was used for nanomechanical property characterization. The acquired data reveals that the hardness of the yarn is about 100 times greater than the matrix it is embedded in with forces being measured in nanonewton resolution and distances in micrometers. This investigation of the textiles sample is reflective of AFM’s effectiveness in allowing textiles researchers to explore the root, nanoscale causes of desirable macroscopic traits in novel fabric blends and further improve upon them.
INTRODUCTION
Nanotechnology plays an exciting role in the creation of new fabrics for novel purposes. To better integrate nanomaterials into existing fabrics, it is very important to understand the characteristics of these new additions. For example, knowing that particular nanofibers have a high threshold for tearing would suggest that weaving them into a fabric already known to be tear-resistant would further improve that trait without adding much in weight. This is a nanoscale analogue to what has been done to create tough, but light fiber reinforced plastics such as fiberglass. Atomic Force Microscopy (AFM) can be used to study the interactions between the fibers and the fabric matrix they will be inserted into to make new textiles. Analysis of the topography of these next-generation textiles as well as their various nanomechanical properties is well within AFM’s capabilities and can provide knowledge helpful in adjusting textile composition to maximize performance gain and minimize production cost.
EXPERIMENTAL
A silicon matrix sample embedded with strands of polyester yarn was provided by Prof. Yan Vivian Li at Colorado State University [1]. The AFM experiment was conducted using that sample under ambient air conditions using a commercial AFM system, the Park NX10 from Park Systems [2], in non-contact mode for topography imaging and phase imaging. Both sets of data are acquired at the same time; topography imaging is useful for observing three-dimensional features on the surface of the sample while phase imaging yields data that can be correlated to the sample’s elasticity. The nanomechanical properties of the sample were characterizedusing force-distance spectroscopy and force-volume mapping. These results were then correlated to data acquired by phase imaging. In force-distance spectroscopy, forcedistance (f-d) curves are used to measure the force that an AFM probe applies vertically to a single point on a sample surface. F-d curves are plots of the cantilever’s deflection, as measured by a position-sensitive photodetector, versus the extension of a piezoelectric scanner [3]. Force-volume mapping builds on force-distance spectroscopy in that it takes an array of single measurement points and turns the collected f-d curves across the sample surface into a 2D characterization map of hardness [3]. Hardness is defined as the slope of the f-d curve given in the units of N/m. Lastly, phase imaging is an AFM technique that makes use of the shift ina cantilever’s oscillation as its tip moves across different features on the sample. The difference in the input signal for a tip’s oscillation versus the ensuing oscillation’s output signal is referred to as a shift in phase [4]. This particular signal can be correlated to several material properties such as elasticity.
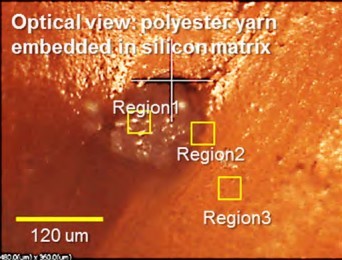
Figure 1: Cross-section of Silicon gel matrix with embedded strand of polyester yarn. Three regions were selected for further investigation: Region 1 on the yarn itself, Region 2 at the interfacial region between the yarn and matrix, and Region 3 on the matrix surrounding the yarn.
RESULTS & DISCUSSIONS
A cross-section view of the silicon matrix (pink in color) is shown in Figure 1, which was taken with an optical microscopy built in to the Park NX10 AFM system, with a strand of polyester yarn (dark circular feature in center, 100-150 µm in diameter). Three regions were selected for investigation. Region 1 is on the exposed strand of yarn. Region 2 is in the interface between the yarn and the silicon matrix surrounding it. Region 3 is in an area composed entirely of the matrix.
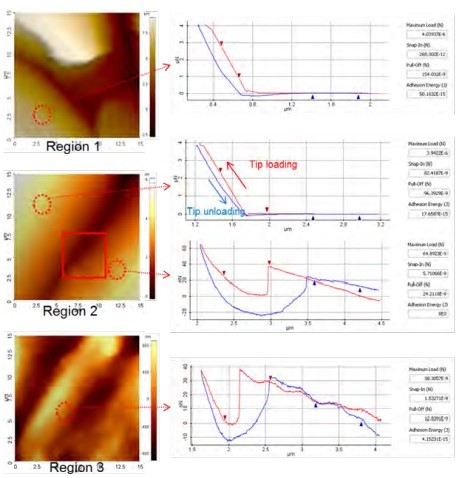
Figure 2. Non-contact AFM topography images with corresponding f-d curves of selected sites inside each of the three regions pictured in Figure 1.
Figure 2 contains non-contact AFM topography images taken from each of the regions selected in Figure 1 as well as f-d curves that were measured at selected sites within each of those regions. The shape of the f-d curves correlate to a measure of the physical interaction between the tip and sample; in this case, the tip-sample distance vs. the force load on the tip cantilever. The slope of an f-d curve is steeper when the tip presses on a harder sample. In Region 1, a location on the sample’s yarn, a site in its lower-left corner was selected for force-distance spectroscopy. The f-d curve at this site reveals the force applied by the tip to the sample increases by about 4 µN over a distance of about 0.5 µm as the tip pushes down onto the surface. In Region 2, a pair of sites was measured at the sample’s interfacial region: the first site is in the left half of the image (the area composed of yarn) and a second site in the right half of the image (an area composed of the matrix). The f-d curve for the yarn side of the region again exhibits a force of about 4 µN being applied by the tip to the sample over a distance of about 0.5 µm. The f-d curve at the site corresponding to the matrix portion of the region yields different data. An initial increase of just under 40 nN in the force applied by the tip to the sample occurs over a distance of approximately 1.25 µm. At which point a steep drop-off of about 40 nN in the tipapplied force is observed. It is possible that the drop-off in applied force is due to the tip being pulled onto the surface of the silicon matrix. A second increase in tip-applied force occurs immediately afterward as the probe continues pressing onto the matrix. This second increase in force is measured to be about 50 nN over a distance of 0.5 µm. In Region 3, a location on the sample’s silicon matrix, we observe a two-stage force load increase similar to the one exhibited by the matrix half of the previously investigated interfacial region. The initial tip-applied force builds up to about 40 nN over a distance of 1.5 µm just before sharply decreasing to about 0 nN. Again, this sudden decrease in applied force is speculated to be the moment in which the tip has snapped onto the surface of the silicon matrix. Shortly thereafter, a second increase in tip-applied force is again observed as the probe continues to be pushed down onto the matrix resulting in a load increase of about 40 nN over a distance of about 0.5 µm.In this investigation, f-d curves taken from a region within a strand of yarn show a force load on the tip’s cantilever that is approximately 100 times greater than the load shown on an f-d curve from the silicon matrix at the similar tip-sample distances.
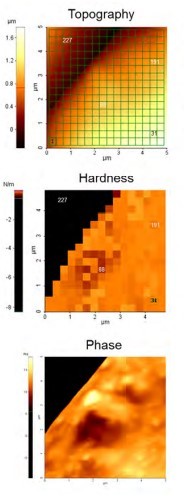
In order to increase the scope of the study from single points to whole sections of the sample’s surface, force-volume mapping was applied as depicted in Figure 3. This technique allows us to create a 2D map of the sample’s nanomechanical properties—in this case, hardness. To begin, a small area within Region 2 as shown in Figures 1 and 2 was selected for hardness mapping as the interfacial region of the sample would allow us to investigate both the yarn and matrix simultaneously. This location is indicated by the inset red square in the non-contact AFM topography image for Region 2 shown in Figure 2. The location for force-volume mapping measures 5 x 5 µm and is depicted in all of the images making up Figure 3. The next step was to overlay a 16 x 16 grid over the location to be mapped thus creating an array of 256 total sites. F-d curves were measured at the midpoint of each of these sites and the collected data were translated into a 256 pixel hardness map where each pixel represents the sample hardness detected at each site’s midpoint. Note the sharp difference in the colors of the hardness map’s pixelswhich closely follows the interfacial region’s border between the yarn and the matrix as shown in Figure 3’s topography image. A similar phenomenon is observed with the phase image as well—the upper-left portion of the phase image corresponds to the yarn and has a profoundly different phase signal than the remaining portion of the image depicting the matrix. This indicates that the phase shifts in the cantilever’s oscillation are markedly different when the probe moves across the yarn versus across the matrix—suggesting a difference in material elasticity.

Figure 3. Force-volume mapping array of the sample’s interfacial region and the hardness map generated from it. The hardness data correlates to the phase image of the same interfacial region.
The final leg of the investigation repeated the f-d curve comparison that was depicted in Figure 2; however, this time the sites selected for analysis were exclusive to the interfacial region of the sample focused on in Figure 3. A total of 4 sites were selected from the array of 256 superimposed on the topography image in Figure 3 and are referred to hereafter as sites 31, 88, 191, and 227. The first three sites are located within the matrix area of the interfacial zone whereas site 227 is located on the yarn. The f-d curves for each of the four sites are shown in Figure 4. The f-d curve of site 227 is shaped as expected given our experience in measuring Region 1 (yarn) on Figure 2. Again, a force load of about 4 µN over a distance of about 0.5 µm is observed. Sites 31, 88, and 191 also have f-d curves that were also anticipated by having previously measured Region 3 (matrix) on Figure 2. These three sites all have the same force load increase marked by a steep drop-off in tip-applied force as the probe snaps onto the matrix. The ensuing second force load increase is again measured to be around 40 nN over a distance of 0.5 µm. This 2D mapping data is consistent with the single-point forcedistance spectroscopy data acquired earlier in the investigation.
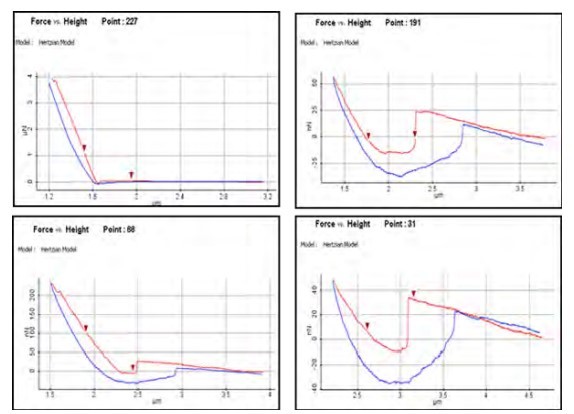
Figure 4. F-d curves of sites 31, 88, 191, and 227 from the sample’s interfacial region hardness map as shown on Figure 3.
Given that the polyester yarn has been observed here to be around 100 times harder than the gel matrix it isembedded in, it is reasonable to propose that the gel’s original resistance to certain types of damage may have been positively augmented by the embedded yarn. The nanomechanical property focused on during this investigation was hardness. The hardness of a material is generally correlated to its elasticity, plasticity, and/or its resistance to fracture. In fiber reinforced plastics, embedded fibers allow a novel composite to remain in one piece despite having a large, shattering force applied to it. The composite also has potentiallysignificant weight savings when compared to the material it is replacing. When applied to textiles and apparel, nanofibers such as the yarn investigated here can be embedded in more than just gel matrices and have been woven into existing fabrics such as cotton to confer traits such as increased aerosol filtration [5] or the ability to self-clean [6]. A nanofiberspecifically selected for its hardness may conceivably increase a composite fabric’s damage resistance leading to immediate uses in ballistics as well as other applications that require clothing with heightened durability with acceptable or even negligible increases in weight.
SUMMARY
The topography image, phase image, and a nanomechanical property map (based on f-d curve data) of a silicon gel matrix and polyester yarn sample were all created using the Park NX10 from Park Systems, a commercially available AFM system [2]. The data collected in this study suggests the yarn is approximately 100 times harder than the matrix it is embedded in. All data acquisition was performed with forces being measured on the order of nanonewtons across distances as small as micrometers. Performing such highprecision measurements demonstrates AFM’s ability to characterize key material properties at nanoscale. This is especially important to understand the interactions of components in novel composites such as next-generation textiles which are now being designed with nanomaterials in mind. Investigations such as the one conducted here can help researchers comprehend the source of macroscopic effects blending materials may manifest starting at the smallest of scales. This knowledge can in turn inform subsequent strategies to design future iterations with increasing performance and decreasing cost.
REFERENCES
[1] Li Research Group. (n.d.). Retrieved April 22, 2016, from https://sites.google.com/site/ smartextilesnanotech/
[2] Park NX10 – Overview. (n.d.). Retrieved April 30, 2016 from http://www.parkafm.com/index.php/products/ research-afm/park-nx10/overview
[3]Park AFM Nanomechanical Mode. (n.d.). Retrieved April 22, 2016, from http://www. parkafm.com/index.php/park-afm-modes/ nanomechanical-modes
[4] 17.3.3 Phase Imaging. (n.d.).In W. N. Sharpe (Ed.), Spring Handbook of Experimental Solid Mechanics (p. 430).Springer Science & Business Media.
[5] 10.3 Nanofibers as Filters. (n.d.).In Kiekens, P., &Jayaraman, S. (Ed.), Intelligent Textiles and Clothing for Ballistic and NBC Protection: Technology at the Cutting Edge.(p.210). Springer Science & Business Media.
[6] Pannett, R. (2016, April 25). An End to Laundry?The Promise of Self-Cleaning Fabric. Retrieved April 30, 2016, from http://www.wsj. com/articles/an-end-to-laundry-the-promiseof-self-cleaning-fabric-1461600182