Myung-Hoon (Brian) Choi, Hanaul Noh, Jason Hsieh, Ashton Enrriques, Gilbert Min, Jake Kim, Xingchen Ye, Lane A. Baker, Stefan Kaemmer
Abstract
Cetyltrimethylammonium bromide (CTAB) is one of the most widely used surfactants in the aqueous synthesis of colloidal gold nanocrystals. Although essential for directing crystal growth and stabilizing nanoparticles during synthesis, residual CTAB can significantly influence nanoparticle performance in applications such as catalysis, sensing, and electrochemistry. Understanding how CTAB is distributed on individual nanoparticles under hydrated conditions is therefore critical for both fundamental studies and practical applications. In this work, a correlative microscopy approach combining in situ atomic force microscopy (AFM) and scanning electron microscopy (SEM) was used to characterize CTAB adsorption on individual gold nanocubes (Au NCs). By correlating AFM topography acquired in liquid with SEM measurements obtained from the same particles, the thickness and distribution of adsorbed CTAB were quantified at the single-particle level. Statistical analysis revealed an average CTAB thickness of 2.9 ± 2.4 nm, closely matching the theoretical molecular length of CTAB. The results demonstrate heterogeneous ligand coverage among individual nanocubes and highlight the value of in situ AFM for evaluating ligand structure and distribution under native hydrated conditions.
Introduction
Gold nanoparticles have attracted sustained interest because of their unique optical, electronic, catalytic, and physicochemical properties¹. Their applications span biomedicine, sensing, catalysis, plasmonics, and energy-related technologies. Early research focused primarily on spherical nanoparticles; however, advances in colloidal synthesis have enabled the production of nanocrystals with precisely controlled sizes, shapes, and exposed crystallographic facets²,⁴. These developments have expanded the functional capabilities of gold nanomaterials and created new opportunities to tailor performance through structural design.
A key factor governing nanocrystal growth is the interaction between surface ligands and specific crystal facets. Surface ligands influence surface energy, regulate growth kinetics, and ultimately determine nanoparticle morphology. Among the most important of these ligands is cetyltrimethylammonium bromide (CTAB), a surfactant widely used in seed-mediated synthesis methods. CTAB has been instrumental in the development of anisotropic gold nanostructures, including nanorods, bipyramids, and nanocubes³,⁴.
The role of CTAB extends well beyond synthesis. Residual CTAB remaining on nanocrystal surfaces can affect catalytic activity, charge transfer, interfacial accessibility, and interactions with surrounding environments⁵. Consequently, understanding CTAB adsorption is essential for optimizing nanoparticle performance. While ensemble characterization methods such as spectroscopy and scattering techniques have suggested organized CTAB layers on gold nanostructures, they do not provide direct information about ligand distribution on individual particles⁶.
To address this challenge, gold nanocubes were selected as a model system for investigating CTAB adsorption at the nanoscale. By combining the complementary strengths of AFM and SEM, a correlative measurement workflow was developed that provides detailed information about both particle geometry and surface-bound ligands. AFM offers exceptional vertical sensitivity and can operate in liquid environments where surfactant layers remain hydrated, while SEM provides high lateral resolution and accurate dimensional measurements. Together, these techniques enable characterization of CTAB adsorption on individual nanocrystals with a level of detail that is difficult to achieve using either method alone.
Experimental
Gold nanocubes synthesized through a seed-mediated growth process were used as the model system³. In seed-mediated synthesis, the morphology of a nanocrystal is determined by the relative growth rates of different crystallographic facets. By carefully controlling reaction conditions such as precursor concentration, surfactant concentration, temperature, and reaction time, specific growth pathways can be favored, enabling the formation of cubic nanocrystals dominated by {100} facets. The seed-mediated growth mechanism and resulting morphology of the well-defined gold nanocubes are illustrated by the structural diagram and baseline scanning electron micrograph in Figure 1.
In situ AFM measurements were performed under hydrated conditions using a liquid imaging configuration on a Park NX12 AFM platform. Soft tapping mode was employed with an amplitude of 5–10 nm at a resonance frequency of 25–30 kHz. A USC-F0.3-k0.3 cantilever (NanoAndMore) with a spring constant of 0.1 N/m and an approximately 10 nm tip radius was used to achieve high topographical sensitivity in liquid⁷,⁹. Scanner calibration was performed using a TGQ1 standard sample prior to imaging. The physical assembly of the liquid probe holder, its environmental sealing cover, and its configuration within the AFM scanner head are detailed in Figure 2. AFM data were analyzed using SmartAnalysis and XEI software¹⁰⁻¹².
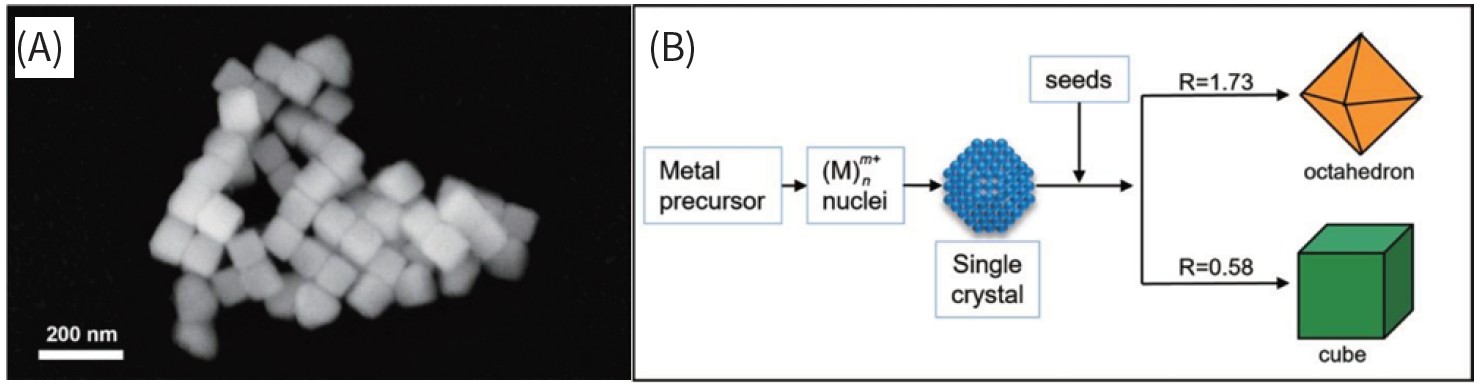
Figure 1. Scanning electron micrograph of a gold (Au) nanocube with {100} FCC (face-centered cubic) facets (A) SEM image showing a gold nanocube with well-defined {100} facets, which were synthesized using the seed-mediated nanocrystal synthesis method. (B) Diagram illustrating the mechanism of the seed-mediated method, which highlights the ratio (R) between the growth rates of {100} and {111} facets (R: {100}/{111}).
Accurate relocation of the same nanocrystal for both AFM and SEM measurements is a critical requirement for correlative analysis. Differences in stage geometry and sample orientation between instruments often make this process difficult. To address this challenge, a sample-position linkage system was utilized, incorporating fiducial markers and enabling coordinate transformation between Park AFM and JEOL SEM systems as shown in Figure 3. This sample-position linkage workflow simplified navigation to identical regions of interest, significantly improving measurement reliability across platforms.
The workflow also demonstrates the flexibility of AFM-based characterization for environmental studies. Transfer hardware designed for air-sensitive materials can be integrated with AFM and SEM platforms, enabling characterization of samples prepared under controlled conditions. Although the gold nanocubes studied here were analyzed under hydrated conditions, the approach illustrates how correlative workflows can be extended to vacuum or inert-environment investigations. The complementary transfer shuttle and vacuum-glovebox hardware configuration designed to protect air-sensitive nanomaterials during multi-instrument tracking are displayed in Figure 4.
Following AFM imaging, samples were dried under ambient conditions and coated with a thin Au/Pd conductive layer prior to SEM analysis. SEM images were acquired using an Auriga FIB-SEM microscope equipped with in-lens and Everhart–Thornley detectors operated at 20 kV accelerating voltage, a 30 μm aperture, and a 5.7–6.0 mm working distance. Line-profile analysis was performed using ImageJ (NIH)¹³. SEM imaging provided accurate lateral dimensions and high-contrast visualization of the nanocube core. These measurements served as a dimensional reference for comparison with AFM-derived topography.
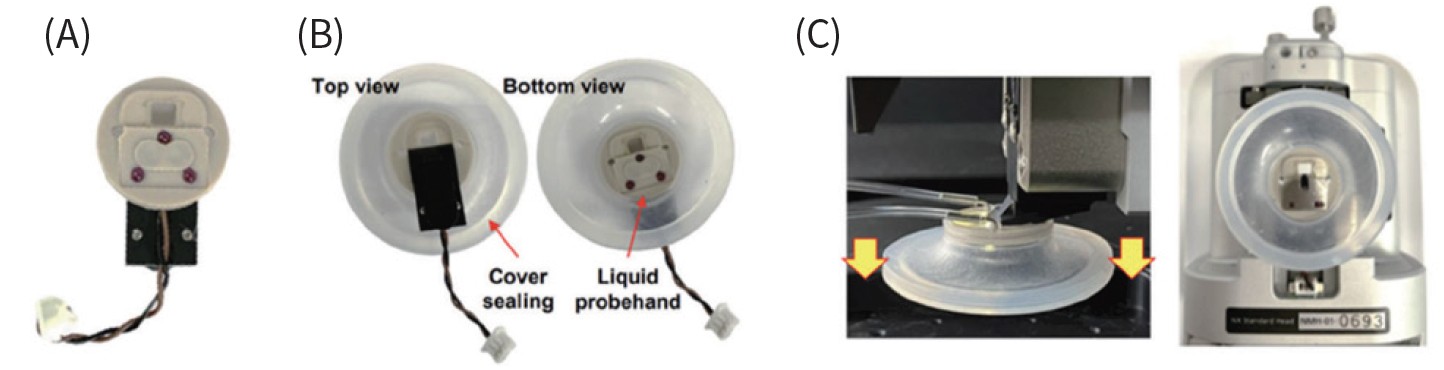
Figure 2. Images of the components used for in situ AFM imaging: (A) Liquid probe holder (LPH), (B) LPH with sealing cover attached, and (C) LPH with sealing cover installed in the AFM head.
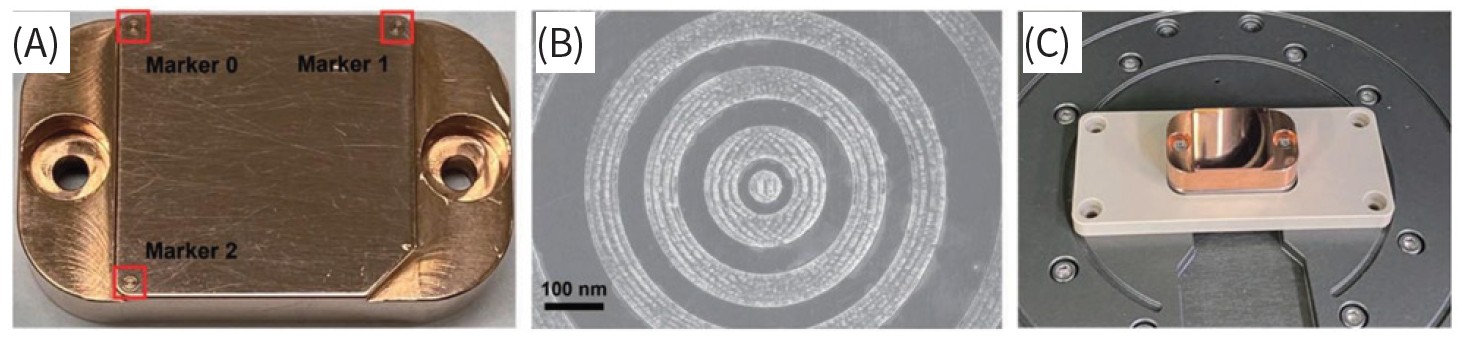
Figure 3. Sample position linkage system for AFM and SEM. (A) Sample holder featuring three fiducial markers (red squares). (B) SEM micrograph displaying the marker pattern used for affine transformation. (C) Linkage sample holder assembled on XY sample scanner of Park AFM
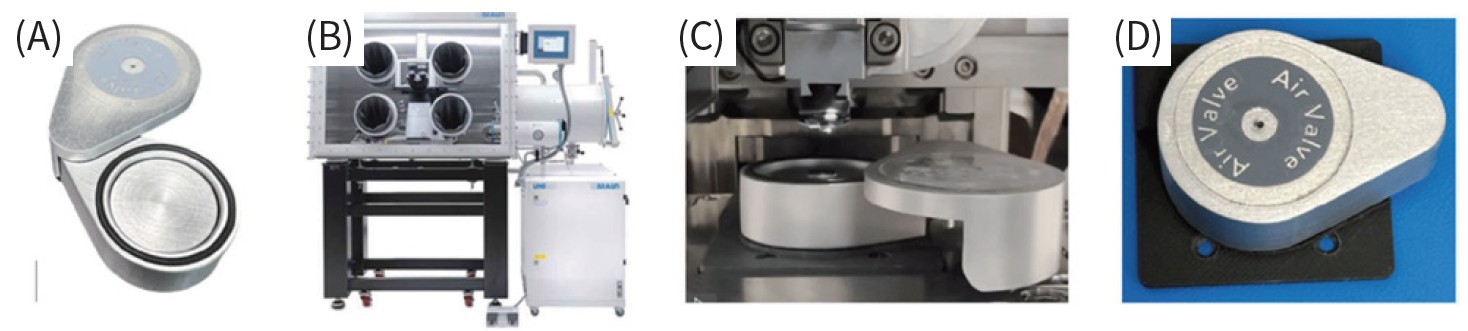
Figure 4. AFM setup for ambient-sensitive sample. (A) Sample transfer shuttle in an open state. (B) A photograph showing Park AFM equipped in a glovebox. (C) an example of AFM measurement where an air-sensitive sample prepared in a glovebox and transferred for AFM measurement. (D) Sample transfer shuttle assembled on an adopter of XY sample stage, ready for transferring to high vacuum AFM or SEM measurements.
Results and Discussion
The correlative workflow consisted of three principal stages. First, topographic information was collected from individual nanocubes while immersed in deionized water. Second, the samples were dried and prepared for SEM imaging. Finally, AFM and SEM datasets from the same nanocrystals were aligned and analyzed together. The sequential phase transitions of the experimental workflow—progressing from native in situ fluid cell characterization to conductive coating deposition and dry-state electron microscopy—are schematized in Figure 5.
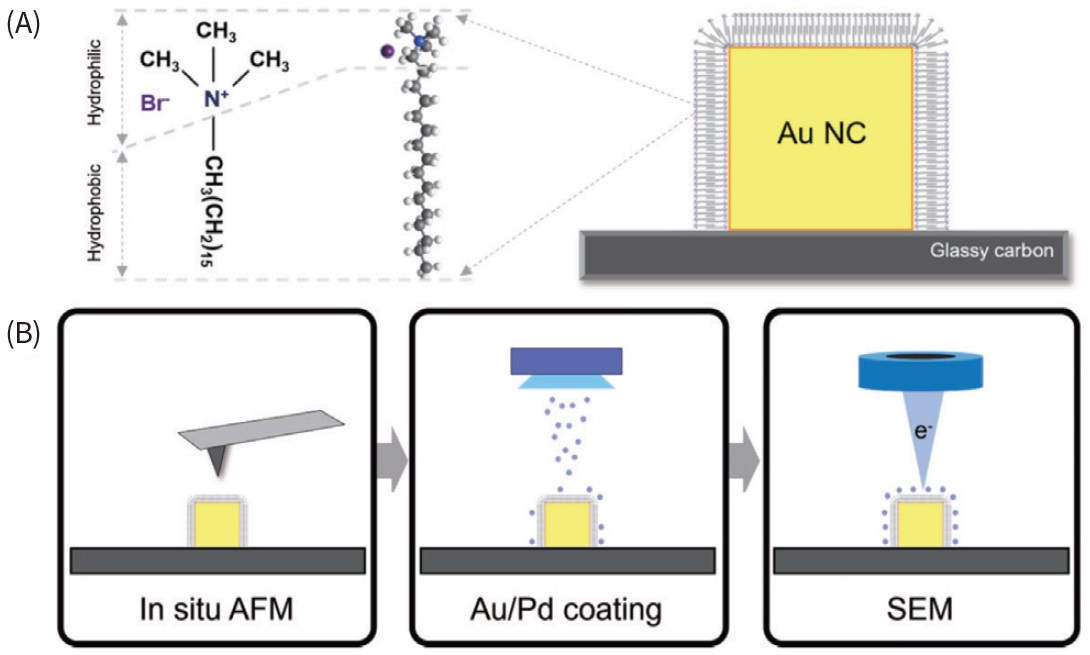
Figure 5. Experimental steps of colocalized in situ AFM and SEM measurements for single nanocrystal analysis. (A) Molecular composition (left) and structure (center) of CTAB, adsorbed to the surface of the Au NC (right). (B) Schematic illustration of the sequential steps involved in the in situ AFM and SEM measurements. The process begins with the in situ AFM measurement, followed by the deposition of an Au/Pd coating on the surface of the nanocubes for subsequent SEM analysis. The estimated length of a CTAB molecule in Avogadro software was 21.7 Å.
Gold nanocubes provide an excellent model system for correlative analysis because their dimensions are expected to be nearly identical along the x, y, and z axes. SEM measurements established an average edge length of approximately 77.5 nm and confirmed that the particles exhibited near-cubic geometry. These measurements provided a dimensional baseline for evaluating differences observed in AFM data.
AFM measurements acquired under hydrated conditions revealed nanocube topography together with contributions from the surrounding CTAB layer. In one representative example, the SEM edge length of a nanocube was approximately 77 nm, whereas the AFM height measured in liquid was approximately 80 nm. The additional height is attributed to the presence of adsorbed CTAB on the top surface of the particle.
The value of the correlative approach becomes particularly evident when analyzing line profiles. SEM defines the dimensions of the nanocrystal core with high precision, while AFM captures the contribution of surface-bound surfactants. By overlaying a geometrical model derived from SEM onto AFM topography, the thickness of adsorbed CTAB can be estimated directly. This strategy enables separation of nanocrystal dimensions from ligand contributions, providing a clearer picture of adsorption behavior. A representative correlative extraction is showcased in Figure 6, highlighting the direct spatial overlay of the core nanocrystal boundaries defined by SEM onto the vertical height profile captured via fluid AFM.
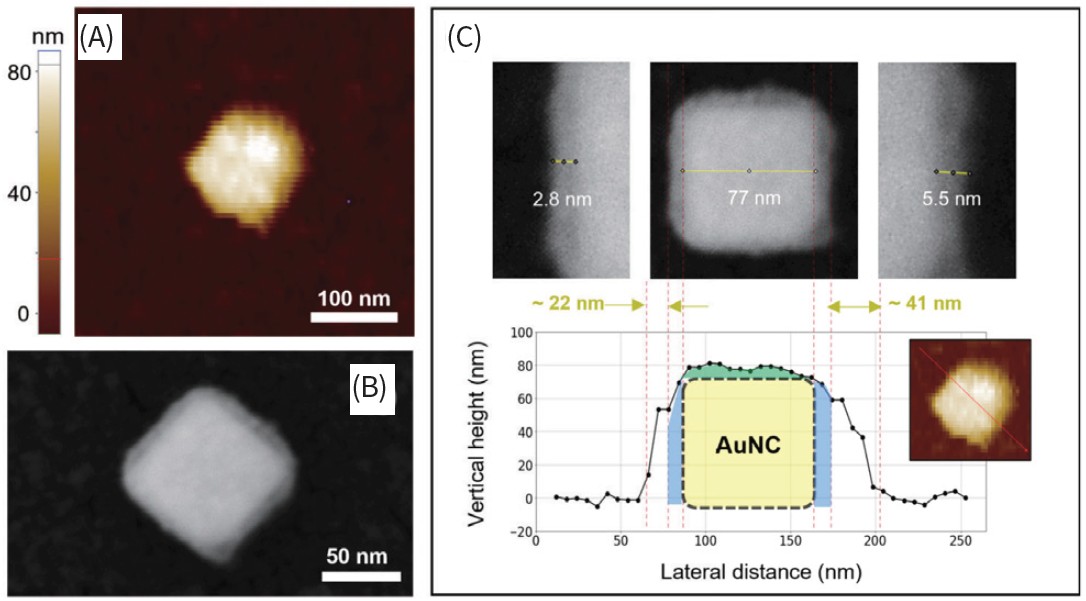
Figure 6. Correlative in situ AFM and SEM data analysis. (A) AFM topography of the same single Au nanocube in the hydrated phase, within deionized water (D.I. H2O), measured using in situ AFM. (B) SEM image of a single Au NC, (C) An example of correlative analysis: SEM image with contrast, revealing the core nanocube and the surfactant layer (including a thin metallic layer) were aligned with the height profile of the same single Au NC extracted from the AFM topography.
Interestingly, variability in lateral CTAB dimensions was greater than variability observed in vertical measurements. Under dehydrated SEM conditions, apparent CTAB thickness ranged from approximately 2.8 to 5.5 nm. After accounting for the conductive coating, these values were broadly consistent with the 2–3 nm vertical thickness observed by AFM. Under hydrated conditions, however, AFM measurements suggested significantly larger lateral dimensions, indicating expansion and redistribution of the surfactant layer in aqueous environments.
These observations highlight the importance of evaluating ligand structure under native conditions. Surfactant layers may adopt different configurations when dehydrated, potentially leading to interpretations that do not fully reflect their behavior during operation. In situ AFM therefore provides valuable information that complements conventional ex situ characterization approaches.
Three-dimensional visualization further enhanced interpretation of the results. By combining AFM-derived topography with SEM-derived dimensions, the spatial distribution of CTAB surrounding individual nanocubes could be visualized directly. The nanocube core was represented using dimensions measured by SEM and positioned within the AFM topographic envelope. This approach enabled a realistic representation of ligand distribution on each particle.
Four representative nanocubes were analyzed in detail. Although the particles displayed similar overall dimensions, substantial differences were observed in CTAB coverage. Top-surface CTAB thicknesses ranged from approximately 1 to 5 nm. Some particles exhibited relatively uniform coverage, whereas others showed localized regions of greater thickness. These observations clearly indicate that CTAB adsorption is not identical from particle to particle, even among nanocrystals synthesized under the same conditions. The striking spatial variations in ligand distribution are mapped across individual particles using three-dimensional topographic models overlaid with volumetric geometric references in Figure 7.
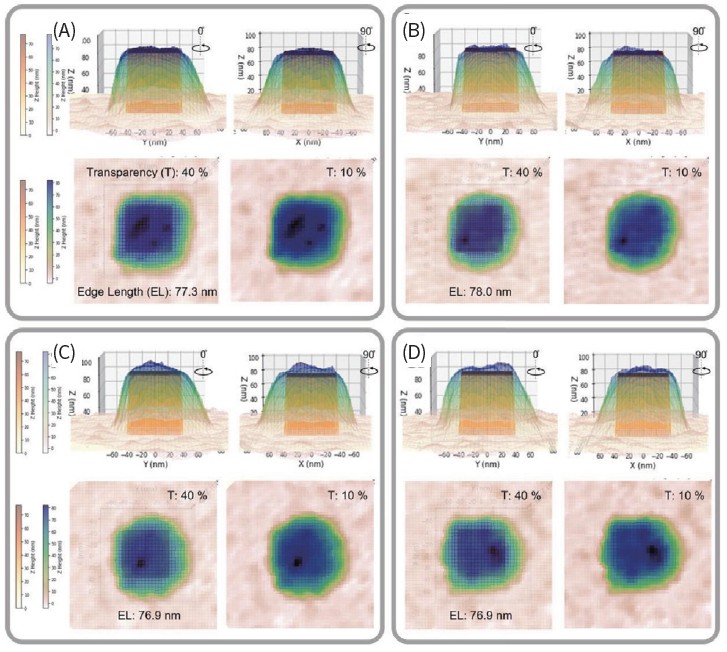
Figure 7. 3D visualization of correlative in situ AFM and SEM measurements of single nanocubes (A)-(D). Images show four distinct nanocrystals exhibiting heterogeneous ligand adsorption on their top surfaces. Edge lengths were determined from SEM measurements (see Fig. 6). Top two rows: side views of image overlay. Bottom row: top views.
The ability to visualize such heterogeneity represents a major advantage of the correlative methodology. Ensemble measurements provide average information about ligand coverage but do not reveal particle-to-particle variations. By contrast, the present approach enables direct observation of local adsorption behavior at the single-particle level. Such heterogeneity may have important implications for nanomaterial performance. Variations in ligand coverage can influence accessibility of active sites, alter interfacial interactions, and affect catalytic or sensing behavior. Understanding these differences is therefore important when attempting to establish structure–property relationships in nanoparticle systems.
Why Hydrated-State Characterization Matters
One of the most important outcomes of this work is the demonstration that hydrated-state characterization provides insights that may not be obtainable through conventional dry-state measurements alone. Surface ligands exist within a dynamic environment influenced by solvent interactions, molecular packing, and surface chemistry. Removing the solvent can alter these interactions and change the apparent structure of the ligand layer.
The AFM measurements performed in liquid revealed evidence of CTAB expansion and redistribution that was not apparent from SEM analysis. This observation underscores the importance of studying nanomaterials under conditions that more closely resemble their intended operating environments. For applications involving aqueous systems, measurements performed in liquid can provide a more realistic picture of ligand organization and behavior.
The findings also illustrate the value of combining complementary techniques. SEM excels at defining nanocrystal geometry, while AFM captures nanoscale topographic features associated with hydrated surface layers. When integrated into a correlative workflow, the two methods provide information that neither technique could deliver independently.
More broadly, the approach demonstrated here is applicable beyond CTAB-coated gold nanocubes. Many nanoparticle systems rely on ligands, polymers, biomolecules, or surfactants to control synthesis and functionality. The ability to characterize these surface layers directly at the single-particle level offers new opportunities for understanding and optimizing nanomaterial performance.
Statistical Analysis of CTAB Adsorption
To quantify CTAB adsorption more rigorously, statistical analysis was performed using height data extracted from the top surface of a representative nanocube. The properties of gold nanoparticles are strongly influenced by the complex interactions among their surface ligands, the surrounding solvent, and the nanoparticle core itself¹⁴⁻¹⁶. Correlative alignment between AFM and SEM data enabled accurate definition of the nanocube geometry and isolation of the contribution arising from the surfactant layer.
A total of 76 measurements were collected from the top surface region. The nanocube height determined from SEM was subtracted from the corresponding AFM height values, producing a dataset representing CTAB thickness. The resulting distribution was analyzed using histogram and box-plot representations, with the quantified surfactant distribution, data point mapping, and corresponding statistical variance compiled visually in Figure 8.
The average CTAB thickness was found to be 2.9 ± 2.4 nm. This value agrees closely with the theoretical molecular length of CTAB, approximately 2.2 nm, estimated using molecular modeling. The agreement supports the interpretation that much of the observed surface layer corresponds to individual CTAB molecules adsorbed on the gold surface.
At the same time, the broad distribution demonstrates substantial heterogeneity in adsorption behavior. Measured thicknesses ranged from approximately 1 to 10 nm, indicating the coexistence of multiple adsorption states. Some regions appear consistent with a single molecular layer, whereas others suggest the presence of multilayer assemblies.
The statistical analysis reinforces observations obtained from the three-dimensional visualizations. Rather than forming a perfectly uniform coating, CTAB exhibits significant local variation across the nanocube surface. These findings emphasize the importance of characterization methods capable of probing individual particles and local surface environments.
More broadly, the results demonstrate how correlative AFM–SEM analysis can bridge the gap between molecular-scale surface information and nanoparticle-scale structural characterization. The approach provides quantitative measurements while preserving spatial information regarding ligand distribution and organization.
Conclusions
This study demonstrates a practical correlative microscopy strategy for investigating surfactant adsorption on individual nanocrystals. By combining in situ AFM measurements performed under hydrated conditions with SEM measurements acquired from the same particles, CTAB adsorption on gold nanocubes could be characterized with high spatial precision.
The methodology leverages the complementary strengths of both techniques. The sample-position linkage system between the Park AFM and JEOL SEM platforms enabled reliable acquisition of highly colocalized datasets from identical nanocrystal locations. AFM provides sub-nanometer sensitivity in the vertical direction and enables measurements in liquid environments where ligands remain hydrated. SEM supplies accurate dimensional information and high lateral resolution, allowing the nanocrystal core to be defined precisely. Together, these capabilities enable detailed characterization of nanoscale surface layers that would be difficult to evaluate using either technique alone.
Correlative analysis revealed heterogeneous CTAB coverage across individual nanocubes and among different particles. Statistical evaluation yielded an average CTAB thickness of 2.9 ± 2.4 nm, in good agreement with the theoretical molecular length of CTAB. The observed distribution suggests the coexistence of both monolayer and multilayer adsorption states.
The results highlight the importance of studying ligand behavior under native hydrated conditions. Differences between hydrated and dehydrated environments can influence interpretation of surface structure and ultimately affect understanding of nanoparticle performance. The correlative AFM–SEM workflow presented here therefore provides a valuable framework for investigating ligand adsorption, ligand removal, and nanoscale surface interactions in a wide range of nanomaterial systems.
By enabling direct visualization and quantification of surface-bound ligands at the single-particle level, this approach contributes to a deeper understanding of nanocrystal surface chemistry and offers a broadly applicable strategy for future nanomaterials research.
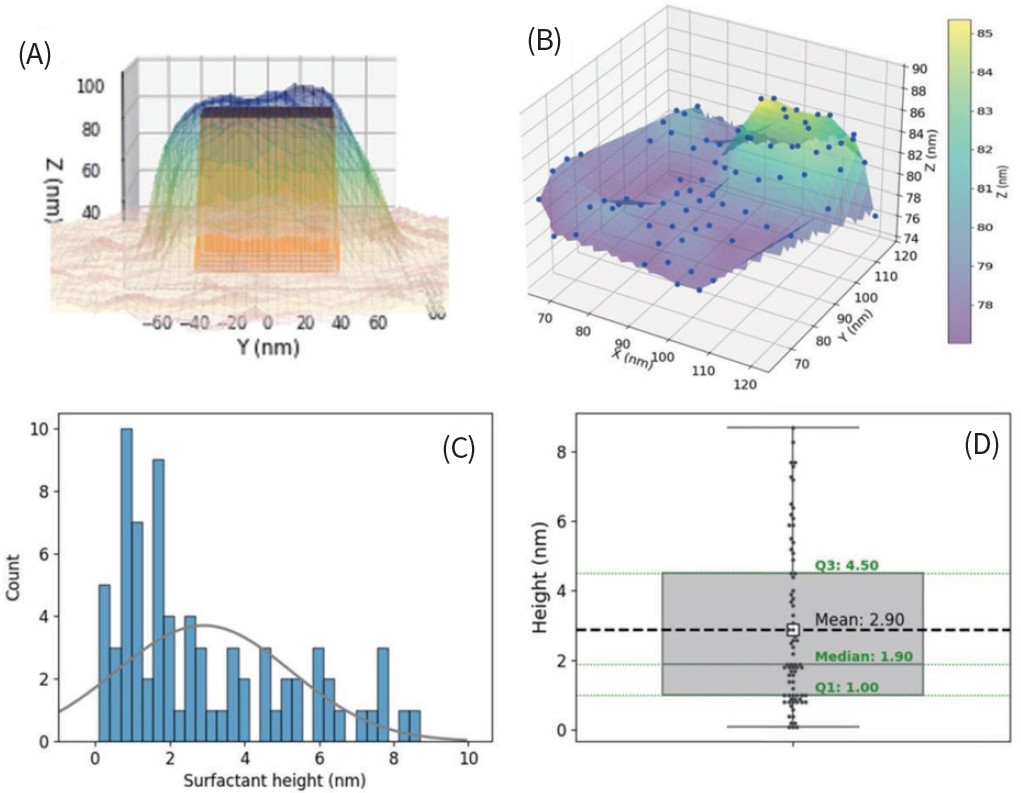
Figure 8. Heterogeneous CTAB molecule adsorption analysis: (A) 3D visualization of correlative in situ AFM and SEM measurements of individual Au NCs. (B) Data points from the top surface of (A) exceeding the nanocube's height (> 76.9 nm), representing CTAB adsorption distribution. (C) Histogram of the data points in (B) with a superimposed normal distribution curve for comparison. (D) Corresponding box plot displaying statistical values of the CTAB adsorption height distribution.
NANOscientific Magazine, 2026