Dr. Teiko Shibata-Seki
Research Equipment Center, Tokyo Metropolitan University, Japan
Presented at the NanoScientific Symposium Japan. Visit NanoScientific website to watch the full presentation: https://nanoscientific.org/on_demand
Introduction
Atomic force microscopy (AFM) is widely used to observe nanoscale structures and measure the mechanical and physical properties of materials. One of the important capabilities of AFM is its ability to operate under liquid environments, which allows researchers to characterize materials and biological systems under conditions closer to their natural state. However, successful AFM observation in liquid requires careful attention to measurement conditions, especially to sample preparation and fixation.
In a presentation at the NanoScientific Symposium Japan, Teiko Shibata- Seki of Tokyo Metropolitan University discussed practical approaches to observing samples in liquid using AFM. Through several examples—from polymer membranes to biological tissues and proteins— she highlighted the critical role of sample preparation and the challenges encountered when attempting stable measurements in liquid environments.
The Development of Microscopy and the Role of AFM
The history of microscopy spans approximately four centuries. Early optical microscopes achieved magnifications of only about nine times. Over the next 300 years, improvements in optical technology expanded magnification to around 1000 times. In the 1930s, the introduction of electron microscopy opened new possibilities for observing structures beyond the limits of optical instruments.
In the 1980s, scanning probe microscopy (SPM) was developed, enabling nanoscale observation of surfaces 1,2. In 1986, the inventors of the scanning tunneling microscope were awarded the Nobel Prize in Physics, marking a major milestone in nanoscale imaging. Since then, further innovations such as super-resolution fluorescence microscopy and cryo-electron microscopy have also received Nobel recognition.
Despite these developments, SPM techniques—including AFM—remain essential tools because they can measure not only surface topography but also properties such as friction force, electromagnetic properties, and mechanical characteristics. Their broad range of measurement capabilities ensures that they continue to play an important role in nanoscience research.
Sample Preparation as a Critical Factor
Advances in microscopy have often been accompanied by improvements in sample preparation techniques. In electron microscopy, for example, methods such as microtomy and ion milling were developed to prepare samples suitable for high-resolution observation.
Today, sample preparation is considered an independent field of research, and specialized preparation instruments are commercially available for some applications. The quality of sample preparation can strongly influence experimental outcomes.
However, sample preparation in scanning probe microscopy has historically relied heavily on the experience and intuition of the operator. Although AFM instrumentation has improved dramatically, fundamental discussions about preparation methods have been limited. As AFM applications continue to expand, especially in liquid environments, the importance of preparation techniques has been enhanced.
Key Factors in AFM Measurements
To obtain reliable AFM data, appropriate measurement conditions must be selected. In addition to setting appropriate measurement parameters, several other factors play critical roles.
- Cantilever Selection
The cantilever must be selected according to the hardness and characteristics of the sample. When observing nanoscale materials, the radius of the AFM tip strongly affects both the resolution and the apparent size of observed structures. - Substrate Surface Roughness
Substrate surface roughness is another important factor. If the roughness of the substrate exceeds approximately one-tenth of the size of the object being measured, it becomes difficult to identify the target object. - Measurements in Liquid
AFM measurements in liquid introduce additional challenges. The resistance a cantilever experiences from a liquid medium is approximately 800 times greater than the resistance it experiences in air. Therefore, it becomes more difficult to stabilize the cantilever against disturbances from the liquid.
Small cantilevers are generally advantageous for measurements in liquid. For biological samples, which often require cantilevers with low spring constants, short and thin cantilevers are preferred. Advances in cantilever fabrication technology have made such probes increasingly available, enabling improved measurements in liquid environments.
Sample Fixation in Liquid
A major challenge in liquid AFM measurements is sample fixation. If a sample is not securely attached to the substrate, it may move or detach during scanning.
Several fixation mechanisms can be used depending on the sample:
- Non-specific adsorption through van der Waals interactions
- Hydrophobic interactions
- Electrostatic interactions
- Immunological reactions enabling specific adsorption
- Active adhesion in living cells
- Chemical adsorption through covalent bonding
Selecting the appropriate fixation method is essential for achieving stable imaging conditions.
Porous Polymer Membrane Study
One example presented involved a highly innovative ultrathin polymeric membrane with reticular cross-linked network developed by Associate Professor Yoshimitsu Itoh of the University of Tokyo 3. This research, published in Science, involved collaboration across multiple fields including solid-state NMR, electron tomography, MD simulations and polymer science.
Conventional artificial porous polymers are typically mechanically weak and brittle. In this work, however, a new membrane structure was developed that is both ultralight and mechanically robust. The membrane can be produced by applying voltage to a polymer solution, forming a film approximately 77 μm thick within about two minutes. The material also exhibits antibacterial and antiviral properties and functions as a smart material whose permeability can be switched by pH.
AFM measurements were performed on membranes formed on silicon wafers and immersed in liquid. Sample fixation relied mainly on van der Waals interactions, and detachment sometimes occurred during measurement. In some cases, the sample remained stable overnight, while in other cases the measurement had to be reattempted after detachment. To investigate swelling behavior, the same region of the membrane was measured repeatedly in liquid. Measurements were made typically four or five times until the thickness reached a constant level.
Young’s modulus was also measured. Because the contact area between the tip and the sample influences the results, the same cantilever was used for all measurements. The membranes swelled in deionized water, and their Young's modulus decreased significantly, and it decreased even more drastically in alkaline water with a pH of 10.
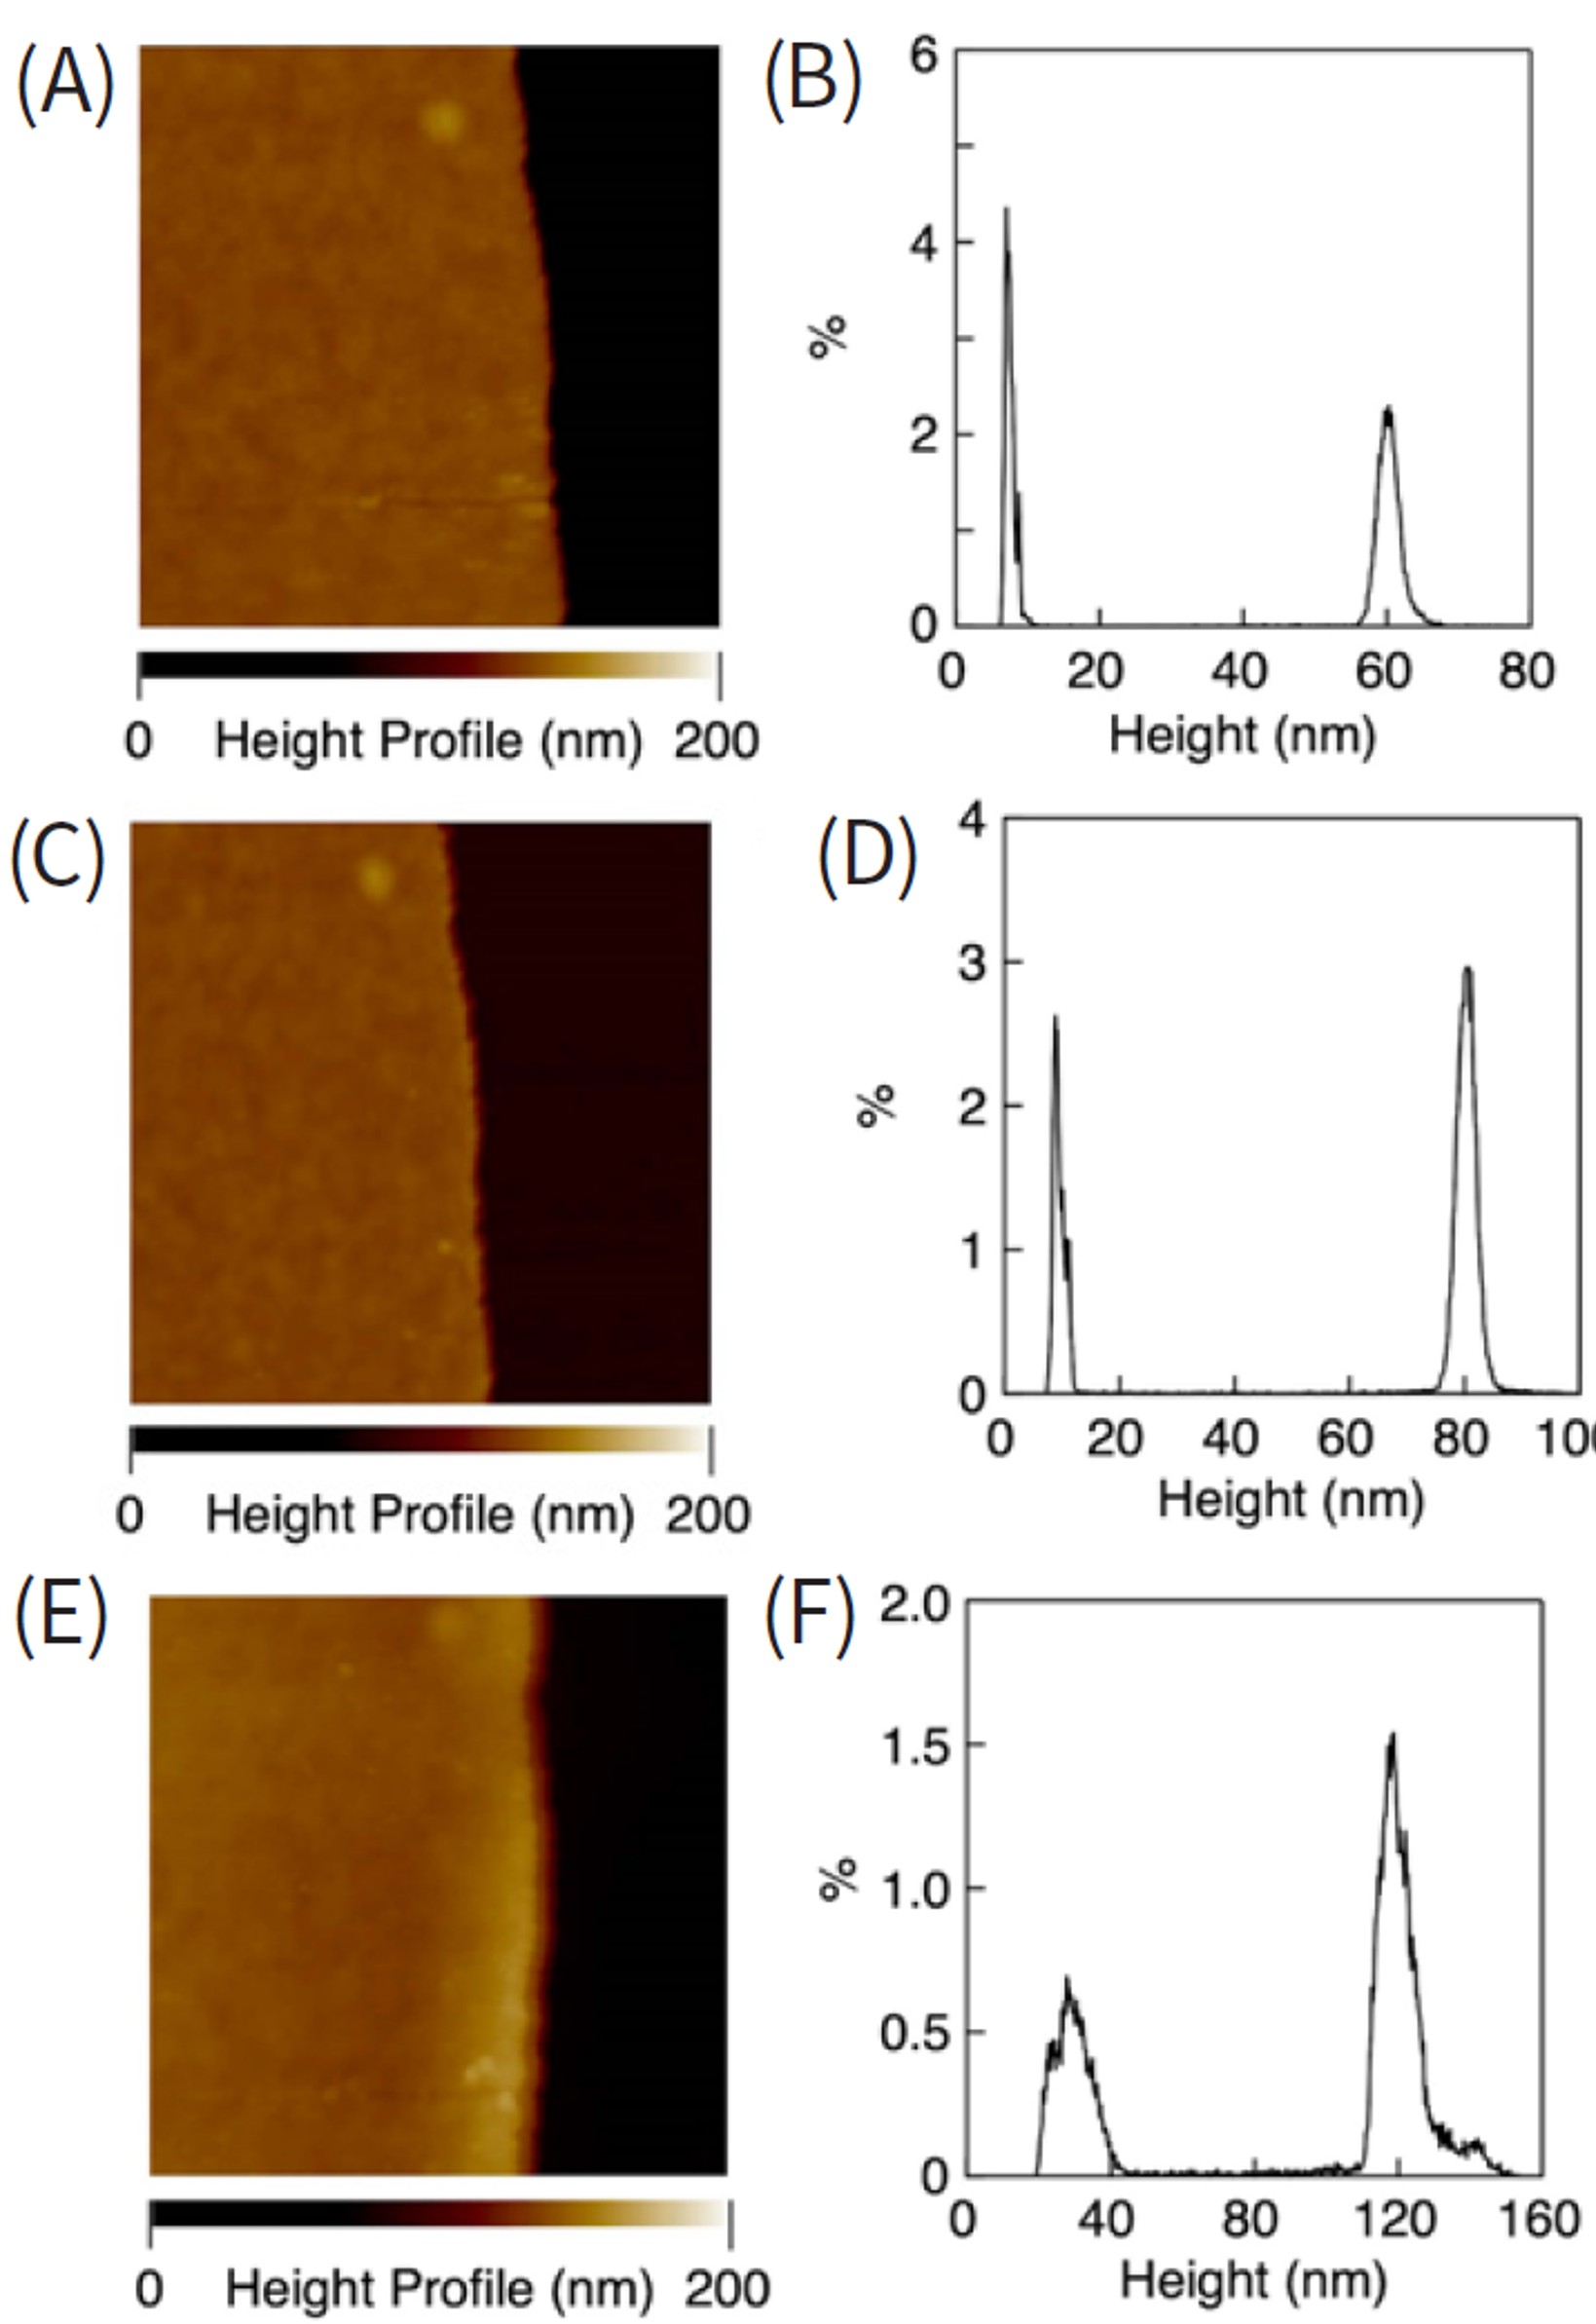
Figure 1. Swelling behavior of a reticular membrane, which synthesized using CHOC1(C1RM). AFM height image and distribution of dry C1RM on a silicon wafer ((A) and (B)), in deionized water ((C) and (D)), and at pH 10 ((E) and (F)). Membrane thickness in deionized water and at pH 10 was measured after reaching a plateau.
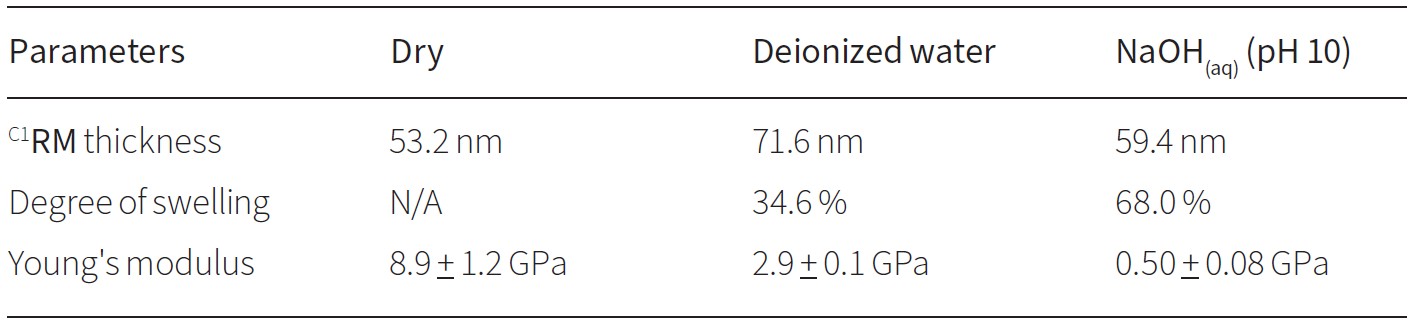
Table 1. Variations in thickness, degree of swelling, and Young’s modulus of C1RM under
different conditions.
AFM Observation of Corneal Tissue
Another example involved AFM measurements of corneal tissue. The cornea is mainly composed of three layers—epithelium, stroma, and endothelium—with a total thickness of approximately 500 μm.
Endothelial cells play a critical role in maintaining corneal function. If these cells are damaged, they do not regenerate and corneal transplantation may be required.
When attempting to observe intact corneal tissue in liquid using AFM, stable imaging was not possible because the sample moved during scanning. To address this issue, the tissue was sliced to a thickness of about 100 μm and the cut surface was fixed to glass.
This preparation allowed stable observation of both epithelial and endothelial cells. The adsorption to the glass relied mainly on van der Waals interactions, although detachment could still occur under some conditions.
The corneal cells were first observed in their native state and were subsequently treated with glutaraldehyde, a protein crosslinking agent commonly used for fixation. AFM imaging and elasticity mapping showed that longer treatment increased cellular stiffness, while histogram analysis confirmed corresponding changes in the elasticity distribution.
By examining areas where endothelial cells were absent, it was also possible to quantitatively measure the height of individual cells 4.
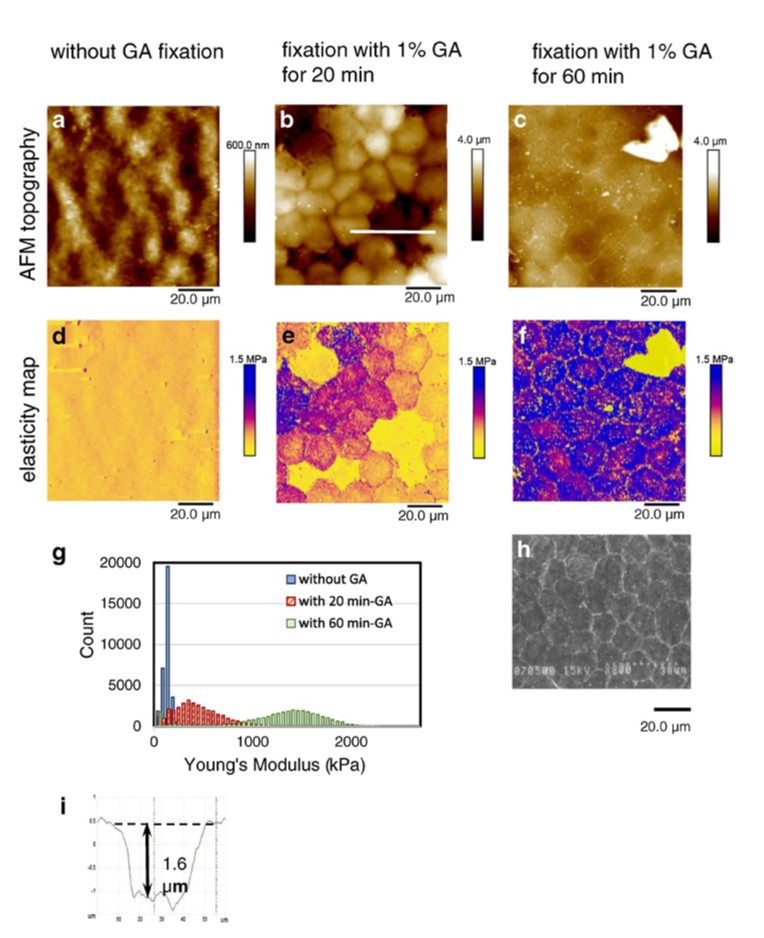
Figure 2. AFM images of corneal endothelial cells in PBS solution. (A), (B), (C) AFM topological images (100 μm x 100 μm) of corneal endothelial cells (z-scale, from left to right, 600 nm, 4 μm, 4 μm). (D), (E), (F) The Young’s modulus maps (z-scale 1.5 MPa) taken simultaneously with the AFM topological images. The Young’s modulus was calculated by using the DMT model of the software equipped with the AFM apparatus. (G) Histogram showing the distribution of values in the Young’s modulus maps for the three samples. Statistical analysis for the value of each pixel in the Young’s modulus map shown in (D) reveals a sharp distribution with average of 116 kPa. The same statistical analysis for the second and third Young’s modulus maps ((E) and (F)) has shown broad distributions with averages of 422 kPa and 1236 kPa, respectively. In each case, the total number of count of pixels in in the Young’s modulus map is 32768. (H) Scanning electron microscope image of the corneal endothelium. This image shows characteristic polygonal cells. Many of them look like hexagonal cells. Sizes of the cells are in a range of ca. 13 - 25 μm. (Reprinted by permission from Elsevier B.V.:Kadonosono K. et al., Effect of intracameral anesthesia on the corneal endothelium, J Cataract Refract Surg, (1998) Vol.24 p.1377-1381). (I) Cross-sectional profile along the white line in (B).
Electrostatic Interactions and Exosome Observation
Electrostatic interactions also influence adsorption behavior in liquid measurements.
Mica, commonly used as an AFM substrate, becomes negatively charged in liquid because surface ions are lost. Surface modification can therefore be used to change the electrostatic properties of the substrate.
By coating mica with polymers carrying different charges, it is possible to control the surface potential of the mica.
This method was applied to the observation of exosomes, small vesicles secreted by cells. On untreated mica, adsorption of exosomes was unstable and imaging was difficult. On positively charged polymer-coated mica, however, stable observation became possible.
In one experiment, only small particles were observed, which were more likely to adhere to the surface. When the remaining solution was transferred onto another substrate, larger particles were eventually detected. This demonstrated that AFM observations reflect what has attached to the substrate rather than the full distribution of particles present in the solution.
Protein (Cadherin) Observation
AFM was also used to observe cadherin, a protein discovered by Professor Masatoshi Takeichi that plays an important role in cell adhesion.
Measurements were performed under conditions similar to physiological ones in order to observe functional structures. Cadherins were linked to another protein for fixation in petri dishes during biochemical experiments to investigate their function, and were immobilized on a hydrophobic substrate via hydrophobic interactions. Using this method, we successfully observed the direct bonding of cadherin molecules in liquid. This was consistent with a state-of-the-art model proposed by X-ray crystallography.
Cadherins function by bonding with Ca²⁺ ions. Furthermore, the cleavage of cadherin bonds upon the addition of a chelating agent was observed in real time using AFM 5.
Liposome Observation and Immunological Fixation
Early AFM experiments on liposomes were performed about 30 years ago, when only contact-mode AFM was available.
Initial attempts to image liposomes failed because the vesicles were swept away during scanning. The problem was solved by using antibody- based immunological fixation, which allowed the liposomes to attach securely to the substrate.
This approach led to the first successful AFM observations of liposomes in liquid. Increasing the applied load also made it possible to observe liposomes detach from the substrate and quantify adhesion forces 6.
AFM Observation of Living Cells
AFM can also be used to study living cells in liquid environments. Unlike passive samples, living cells remain attached through active adhesion mechanisms.
In one study, corneal epithelial cells were cultured and observed while exposed to a drug. Continuous AFM measurements showed that the cells contracted after the drug addition. Such experiments demonstrate that AFM can provide quantitative information at the level of individual cells.
Expanding the Capabilities of Liquid AFM
AFM measurements in liquid environments present significant challenges, particularly regarding sample fixation and stability. However, as the examples described above illustrate, careful preparation and fixation strategies can enable successful observations of both materials and biological systems.
Although many practical details of sample preparation are not always described in published papers, accumulated experience has gradually expanded the range of applications for liquid AFM.
By continuing to refine preparation methods and measurement techniques, researchers can further extend the applicability of AFM to the study of nanoscale phenomena under conditions closer to their natural state.
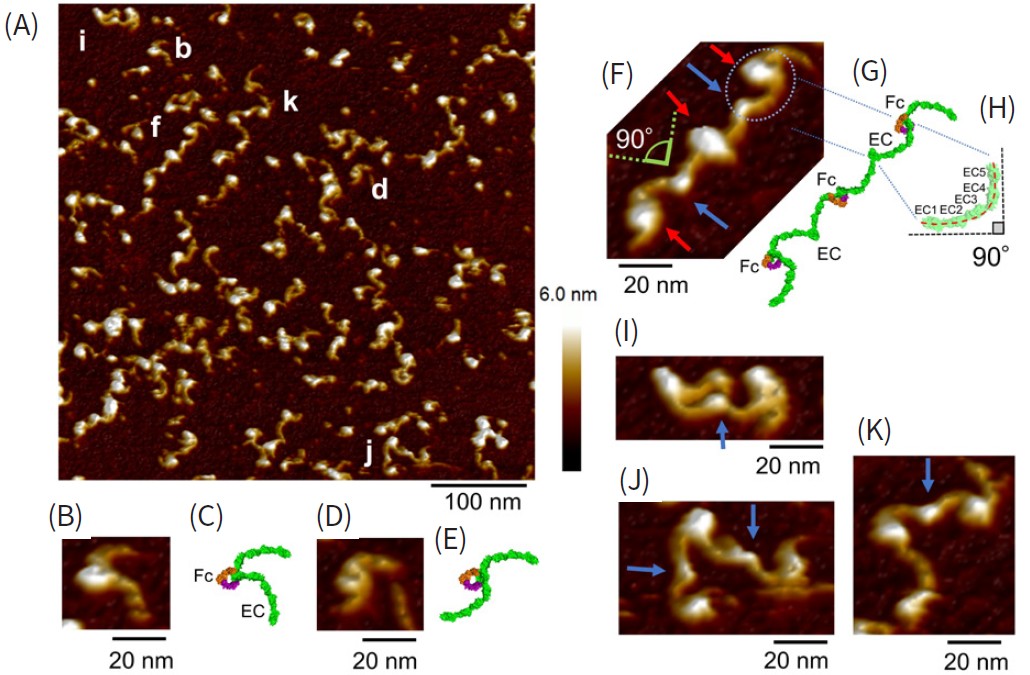
Figure 3. AFM images of E-cadherin-Fc(E-cad-Fc) molecules in a PBS solution containing 0.9 mM Ca2+ at room temperature and their structural models. (A) AFM image of E-cad- Fc molecules. E-cad-Fc molecules were observed in various conformations (scale bar 100 nm). (B) and (D) Magnified AFM images of E-cad-Fc monomer-like structures of the points (B) and (D) in (A) (scale bar 20 nm). (C) and (E) E-cad-Fc monomer models constructed from the AFM measurement results of (B) and (D). The orientation and tilt of the Fc domain are arbitrary due to insufficient resolution of AFM image. (F) Magnified AFM image of E-cad-Fc molecules of the point f in (A) (scale bar 20 nm). Three E-cad-Fc molecules appear trans-bonded (blue arrow) in the Extra Cellular (EC)1 domain. EC domains (blue dotted circle) and Fc domains (red arrow) are distinguishable. (G) E-cad-Fc model constructed from the AFM measurement results of (F). (H) EC domain model. The five EC domains are curved such that the long axis of EC1 is approximately perpendicular to the long axis of EC5. (I), (J) and (K) Magnified AFM images of E-cad-Fc binding structures of the molecules (H), (I) and (J) in (A) (scale bar 20 nm).
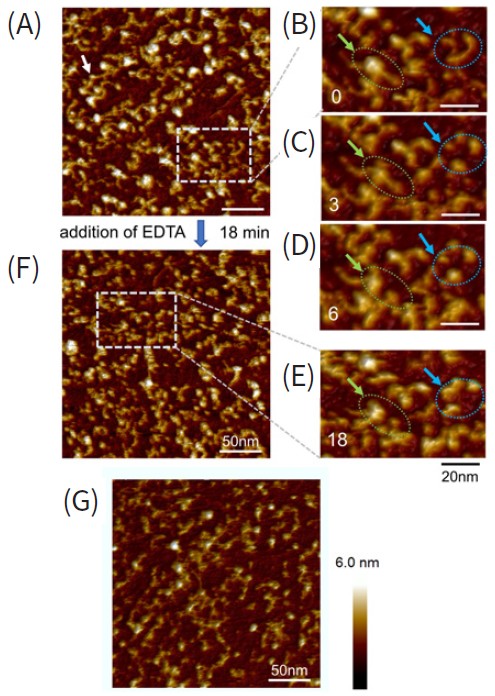
Figure 4. AFM images of the dynamic changes of E-cad-Fc. (A) AFM image of E-cad-Fc in a PBS solution containing 0.9 mM Ca2+ before the addition of chelating agent, EDTA (scale bar 50 nm). It shows an EC domain with a rod-like structure, a trans-binding portion of the EC1 (pointed by white arrow) and an Fc domain. (B) – (D) The continuously acquired AFM images at approximately 0, 3, 6, 18 minutes after addition of EDTA (scale bar 20 nm). (E) and (F) AFM images of E-cad-Fc 18 minutes after addition of EDTA (scale bar 20 nm and 50 nm respectively). (G) AFM image of E-cad-Fc in a PBS solution without Ca2+(scale bar 50 nm).
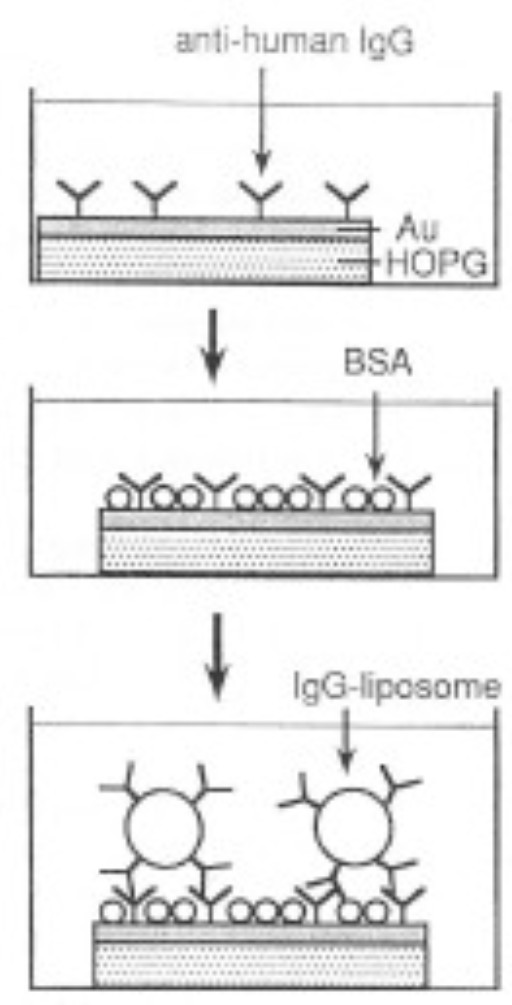
Figure 5. Schematic diagrams of sample preparation
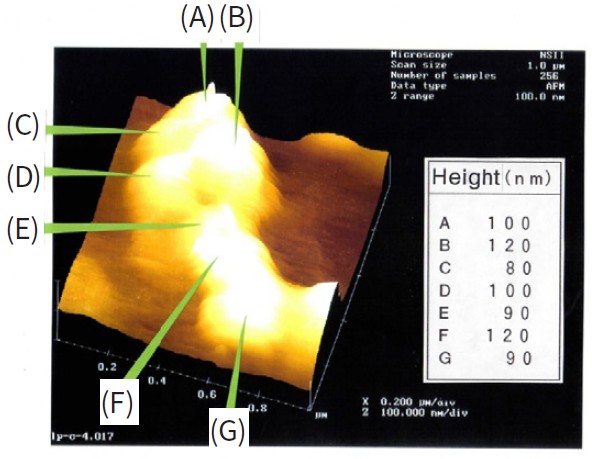
Figure 6. AFM image of liposomes in liquid taken with a standard Si3N4 cantilever-tip (spring constant of 0.06 Nm -1), area 1μm x μm.
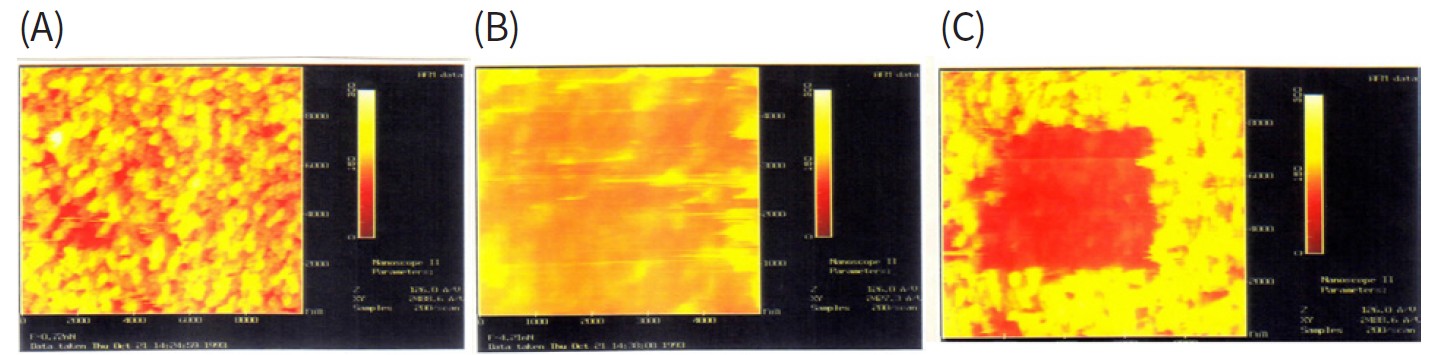
Figure 7. In-situ AFM images of liposomes on substrates taken at different load forces over the same region. Images were taken with a standard Si3N4 cantilever tip (spring constant of 0.12 Nm-1) ; (A) load force was approximately 0.72 nN (scan area 10 μm x 10 μm); (B) load force was approximately 4.2 nN (scan area 5 μm x 5 μm) ; (C) load force was approximately 2.2 nN (scan area 10 μm x 10 μm)
About Dr. Teiko Shibata-Seki
After graduating from the Department of Agricultural Chemistry, Faculty of Agriculture at Hokkaido University, Teiko Shibata-Seki joined Mitsubishi Kasei Corporation (now Mitsubishi Chemical). From the early days of SPM technology beginning with STM, she has been engaged in this field for more than 30 years. In particular, she focused on applications to biological materials and explored techniques for “observing” samples in liquid environments, achieving, for example, the world’s first AFM observation of liposomes in liquid.
At Veeco (now Bruker Japan), she gained extensive experience as an application engineer measuring a wide variety of samples. After receiving her Ph.D. in Engineering from Tokyo Institute of Technology (now Tokyo Science University), she pursued applications in the field of regenerative medicine. At the Biomaterials Center for Regenerative Medical Engineering, the Foundation for Advancement of International Science, she used AFM in liquid to clarify the time-dependent changes in the Ca-dependent structure of cadherin, a cell adhesion protein. Subsequently, at the National Institute for Materials Science (NIMS), she used FM‑AFM to investigate solid–liquid interfacial structures of glycans, which are one of the key factors in cellular differentiation.
Currently, she works at the newly established Research Equipment Center at Tokyo Metropolitan University, where she is responsible for the operation and management of X-ray diffraction instruments, contributing to research support.
References
1. G. Binnig H. Rohrer, C. Gerber et al., Surface Studies by Scanning Tunneling Microscopy, Physical Review Letters 49, 57-61 (1982).
2. G. Binnig, C. F. Quate, & Ch. Gerber, Atomic Force Microscope, Physical Review Letters 56, 930-933(1986).
3. Y. Itoh, T. Aida, T. Shibata-Seki et al., Electric double-layer synthesis of a spongelike, lightweight reticular membrane. Science 389,73-77 (2025)
4. T. Shibata-Seki, K. Tajima, N. Itoh et al., AFM characterization of chemically treated corneal cells. Analytical and Bioanalytical Chemistry 407, 2631–2635 (2015)
5. T. Shibata-Seki, M. Nagaoka, T. Akaike et al., Direct visualization of the extracellular binding structure of E-cadherins in liquid. Scientific Reports 10, 17044 (2020)
6. T. Shibata-Seki, J. Masai, T. Tagawa et al., In-situ atomic force microscopy study of lipid vesicles adsorbed on a substrate. Thin Solid Films 273, 297-303 (1996)
NANOscientific Magazine, 2026