Nano Infrared (IR) Photo-induced Force Microscopy (PiFM): A technique for nanosacle hyperspectral mapping
- 01 Feb 2020
- Volume 19
- NanoScientific Magazine, Spring 2020

Sung Park, Molecular Vista, San Jose, CA 95119
Sung Park, Ph.D.; Molecular Vista, CEO and co-founder. Sung is the CEO of Molecular Vista, which he co-founded with Prof. Kumar Wickramasinghe (UC Irvine, formerly of IBM) in 2011 to provide research and industrial tools for rapid and nanoscale imaging with chemical identification. Sung has over 25 years of experience of industrial R&D, engineering, marketing and sales, and operations. He co-founded Park Scientific Instruments (PSI), which was one of the first commercial companies to develop and sell scanning tunneling microscopes (STM) and atomic force microscopes (AFM). Prior to founding Park Scientific Instruments, he worked as a post-doc at IBM Watson Research Center. Sung earned his Ph.D. in Applied Physics from Stanford University and BA in Physics from Pomona College.
Introduction
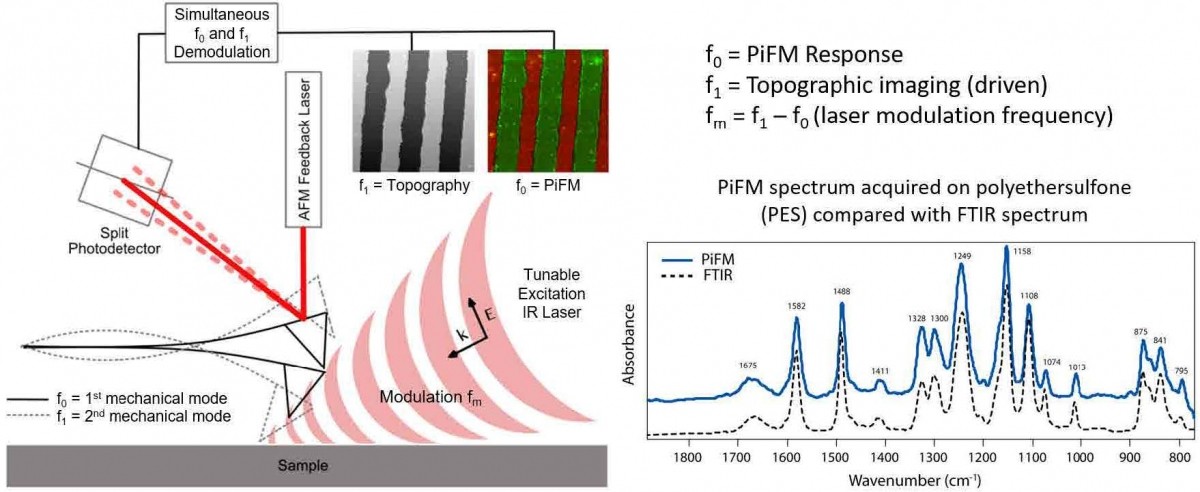
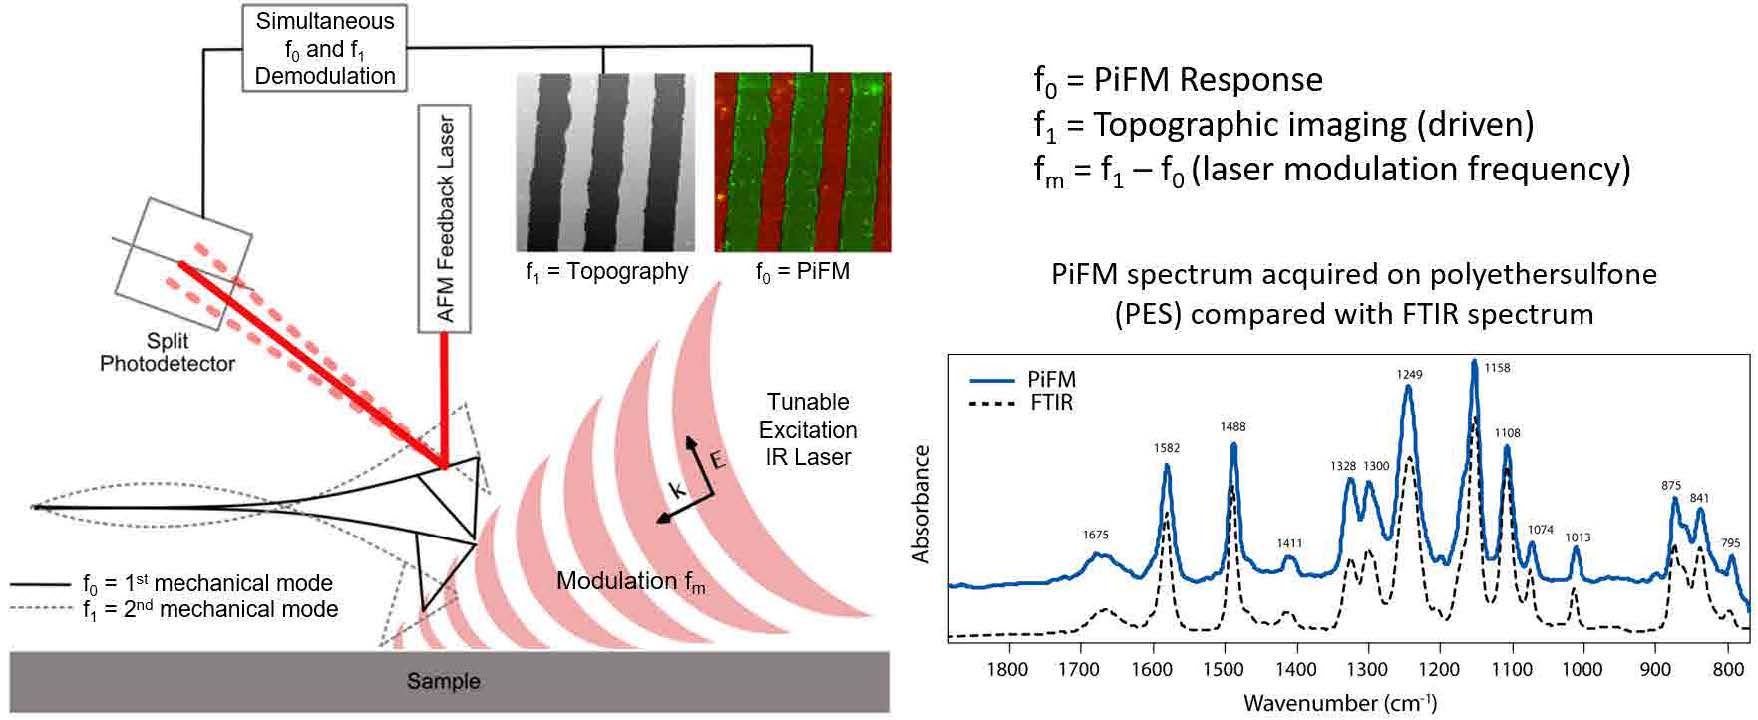
Figure 1. Schematic diagram of PiFM showing the AFM cantilever (two fundamental flexural mechanical modes at f0 and f1 are shown) and the external tunable IR laser used to excite the sample. Inset shows a FTIR spectrum and PiFM spectrum on polyethersulfone; the agreement between the two spectra are excellent even though FTIR and PiFM spectra originate from bulk and 10 nm region respectively.
Advances in nanotechnology have intensified the need for analytical tools that can chemically characterize newly synthesized nanomaterials. While electron microscopy (EM) techniques can identify atomic species through energy dispersive X-ray analysis, they offer little help for identification of molecular materials.[1] For identification of molecular species, well established optical spectroscopy (OS) techniques such as Raman and Fourier Transform Infrared (FTIR) are used; their spatial resolutions are governed by the diffraction limit, on the order of a micron, falling far short of the needs of the nanotechnology and nanomaterial researchers.[1] In order to overcome the diffraction limit of the OS techniques, various near-field techniques based on atomic force microscopy (AFM) have been developed. Techniques such as tip-enhanced Raman spectroscopy (TERS)[2-6] and scattering scanning nearfield optical microscopy (s-SNOM)[7-10] utilize an AFM tip to optically excite the sample just below the tip apex via a tipenhanced near-field. A photon detector, placed in the far-field (far from the sample tip area), collects the emission from both the diffraction limited focal spot (far-field) and the near-field excited volume under the AFM tip. To selectively access the near field information, various methods are employed to suppress the far-field background signal in s-SNOM or greatly enhance the near-field signal in TERS. The suppression in s-SNOM and enhancement in TERS are both technically feasible but render the techniques more difficult to use. To overcome the difficulties associated with the convolution of near-field and farfield information, optical forces on the AFM tip can be measured directly. One such technique, photothermal induced resonance microscopy (PTIR)[11-15], measures thermal expansion due to optical absorption with an AFM tip in contact with the sample. Although this technique is relatively straightforward to operate, thermal diffusion enlarges the effective detection region and compromises the spatial resolution.
Photo-induced Force Microscopy (PiFM)
In this article, we introduce infrared (IR) photo-induced force microscopy (PiFM) [16-22], which combines atomic force microscopy and IR spectroscopy (AFM-IR) to provide a technique for multi-modal nanoscale hyperspectral mapping, i.e., both IR spectroscopy and chemical mapping correlated with topography with sub-10 nm spatial resolution as shown in figure 1. IR PiFM relies on near-field excitation like other near-field microscopes. However, it is the only near-field microscope that acquires the sample’s optical response by measuring the optically induced attractive force (total dipole-dipole force that consists of image dipole force and van der Waals mediated thermal expansion force) in the near-field while rejecting any competing far-field background signals.[22] To generate the photo-induced force (PiF), a widely tunable IR excitation laser, tuned at a specific wavenumber, is modulated at a frequency (fm) to excite the first mechanical resonance, f0, of the AFM cantilever that is operated in non-contact mode with small dither amplitude (~ 1 nm) at the second mechanical resonance, f1. When fm is set at the difference of the two mechanical resonances (f1 – f0), the standard topography (van der Waals force driven) and PiF signals can be acquired simultaneously by using two lockin amplifiers to demodulate the AFM force sensor signal (f1 and f0 will measure topography and IR absorption signal respectively). The PiF signal, measured as the amplitude of the cantilever oscillation at f0, will reflect the magnitude of IR absorption by the sample (this is true for most samples; see reference [22] for the exact nature of measured signal for different kinds of samples) at the excitation wavenumber. By sweeping the laser wavelength while recording the PiF signal, one can generate a PiFM spectrum, which shows excellent correlation with the bulk FTIR spectrum (see figure 1). The topography and PiF signals arise from the same point and allow perfect correspondence between IR absorption and topography.
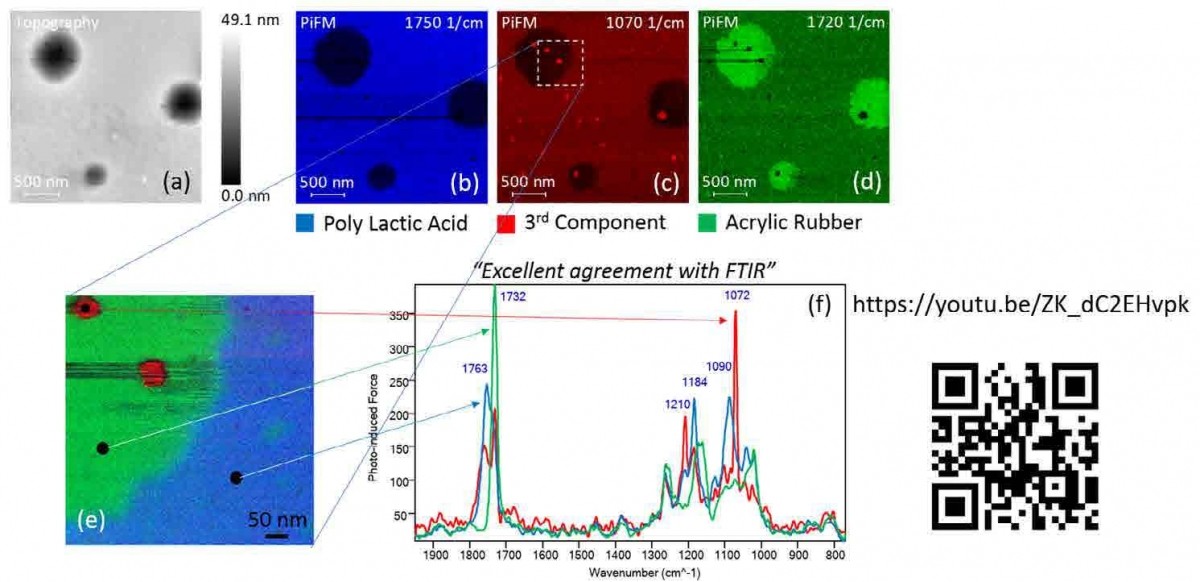
Figure 2. (a) Topography and PiFM images at (b) 1750 cm-1, (c) 1070 cm-1, and (d) 1720 cm-1 for PLA, 3rd component, and ACM respectively. A zoomed in (e) composite image consisting of three PiFM images and (f) three spectra from locations shown in (e). QR code leads to a Youtube video showing acquisition of these data in real time.
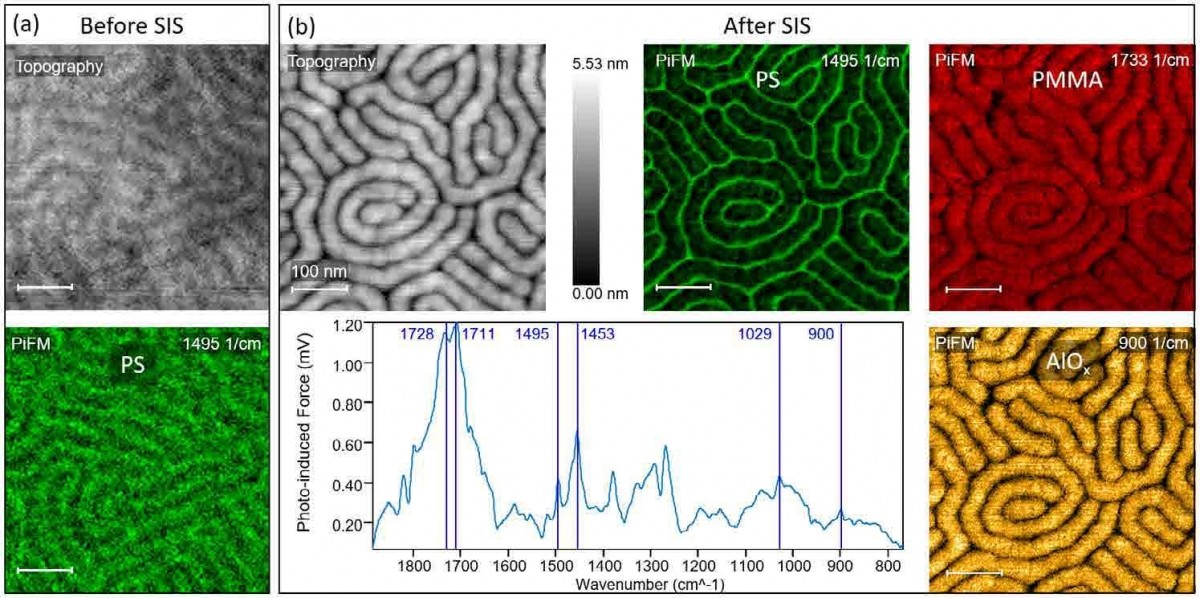
Figure 3. (a) Topography and PiFM image highlighting the PS block of PS-b PMMA block copolymer with full pitch of 41 nm before SIS process. (b) Topography and PiFM images of PS, PMMA, and AlOx molecules acquired at 1495 cm-1, 1733 cm-1, and 900 cm-1 respectively along with a PiFM spectrum after SIS process.
Applications
Figure 2 shows how PiFM can be used to study a polymer blend, in this case, of poly(lactic acid) (PLA)/acrylic rubber (ACM), which combines a biodegradable thermoplastic and a natural elastomer to create a usable and more eco-friendly material.[23] In practice, especially when the sample constituents are unknown, AFM topography (figure 2(a)) may be acquired first. Then a few PiF spectra can be acquired at unique features in topography, which will generate spectra that are like those seen in figure 2(f). Seeing that there are strong peaks at ~1730 cm-1, the laser can be tuned to ~ 1730 cm-1 (in this case, 1750 cm-1) to acquire the AFM topography and PiFM image at 1750 cm-1 (images 2(a) and 2(b)) concurrently. The process can be repeated to acquire PiFM images that show unique features and spectra associated with them. Different PiFM images can be artificially colored and then combined to form a chemical map as shown in figure 2(e) where three PiFM images at 1750, 1720, and 1070 cm-1 are colored blue, green, and red to represent poly(lactic acid), acrylic rubber, and a third component respectively, and combined into one chemical map image. Note that three distinct spectra are acquired from three locations shown in figure 2(e) and displayed in figure 2(f); PiFM spectra can be reliably acquired from regions as small as ~ 10 nm in size. Use the QR code in figure 2 to see a video of how this sequence of data is acquired.
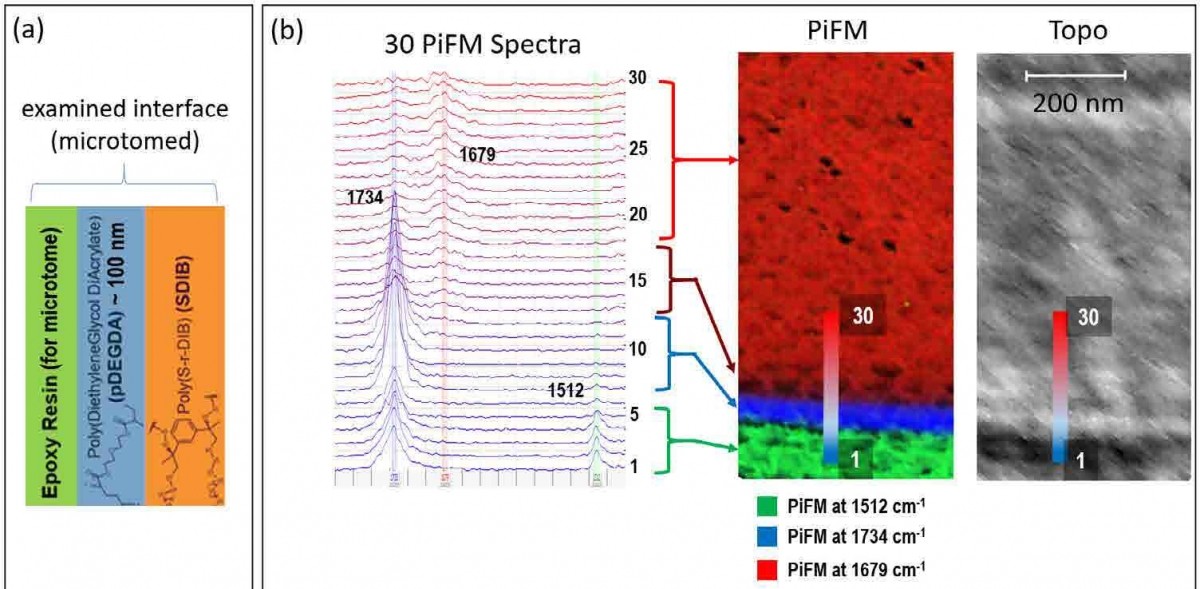
Figure 4. (a) Sample description of the polymer bi-layer cast in resin for cryo microtome. (b) Topography and a composite PiFM image (consisting of three PiFM images acquired at 1512 cm-1, 1734 cm-1, and 1679 cm-1 to highlight resin, pDEGDA, and SDIB respectively) along with 30 spectra taken across the interface.
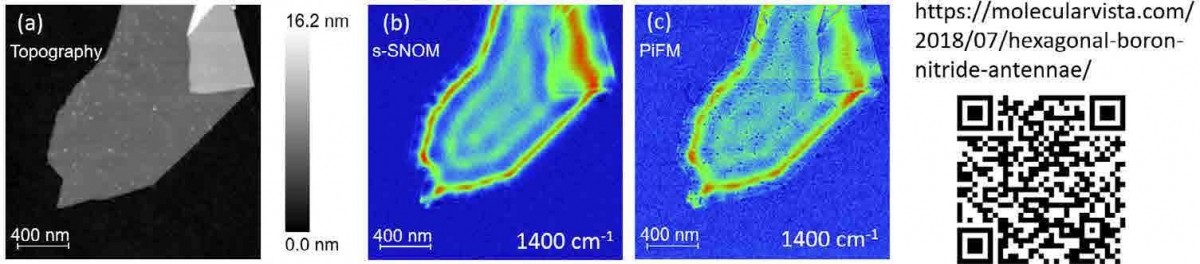
Figure 5. (a) Topography of a hBN flake concurrently imaged by (b) s-SNOM and (c) PiFM at 1400 cm-1, both showing clear surface phonon polariton interference patterns.
Figure 3 shows an organic/inorganic composite system that was analyzed by PiFM. To generate a hard mask for etching for advanced lithography, aluminum oxide is selectively incorporated into PMMA block in a PS-b-PMMA block copolymer thin film through a process called sequential infiltration synthesis (SIS).24 Figure 3(a) shows the topography and PiFM image of the PS block of the PS-b-PMMA with a full pitch of 41 nm before SIS process (500 nm x 500 nm, 128 x 128 pixels). Figure 3(b) shows the topography and PiFM images of PS, PMMA, and aluminum oxide along with a spectrum acquired at a random site of the sample after the SIS process (500 nm x 500 nm, 256 x 256 pixels). The spectrum shows the peaks associated with all three components given the small pitch. PiFM reveals that aluminum oxide selectively infiltrated only the PMMA block, causing a significant swelling of the PMMA block; after the SIS process, PS block has been squeezed to less than 10 nm in width.
PiFM can be used to analyze interfaces between different materials composing a multi-layer system by creating a crosssection of the sample. For thin films such as multi-layer polymers, the sample can be embedded in a resin and cryomicrotomed in order to create a clean cut without surface contamination by the resin. For a crystalline sample such as silicon, it can be cleaved for analysis. Figure 4 shows the PiFM result obtained on the interface of poly(diethyleneglycol diacrylate) and poly(sulfur-rdiisopropenylbenzene), which are abbreviated as pDEGDA and SDIB. Figure 4(a) shows the three layers (resin, pDEGDA, and SDIB) that are exposed via cryo microtome. Of interest is to examine the extent of nanoscale mixing at the pDEGDA and SDIB interface. Given the thin pDEGDA layer (~ 100 nm), we used a mode called hyPIR (hyperspectral PiFM IR) where a PiFM spectrum was acquired at each pixel of the 128 x 128 image data (for 1µm x 1µm region). Even though each spectrum only took about 0.2 seconds, the whole image took abouµt an hour to acquire. Once hyPIR data is acquired, much analysis can be derived from a single data set. Figures 4b(i) shows the topography of the cross-section while figure 4b(ii) is a composite of three PiFM images at 1512, 1734, and 1679 cm-1 to highlight the resin, pDEGDA, and SDIB respectively. From the composite image, we can tell that (1) the interface between resin (colored green) and pDEGDA (colored blue) is clean and abrupt and (2) the interface between pDEGDA and SDIB (colored red) consists of ~60 nm of strong pDEGDA signal and an interface region of ~60 nm where the pDEGDA signal gradually decreases and SDIB signal increases. Since the data has spectra associated with every pixel, we also looked at 30 spectra across the interface (each spectrum is about 10 nm from each other), which are shown in figure 4(b). The IR peaks used to highlight the components are highlighted by vertical bands. Looking at the spectra, we see that the resin peak at 1512 cm-1 is greatly diminished from spectrum 4 to 5 (using the peak at 1734 cm-1, the abrupt change is takes place from spectrum 6 to 7). The SDIB peak at 1679 cm-1 seems to be at full strength around spectrum 18 when the pDEGDA peak at 1734 cm-1 has dropped significantly from spectrum 12 to 13; the mixing between pDEGDA and SDIB takes place from spectrum 12 to 18 (~ 60 nm consistent with the composite image).
PiFM measures the total dipole-dipole attractive force that exists between the tip and the sample in the presence of an excitation light. Since IR PiFM measures the total attractive force, as opposed to only the repulsive force as in PTIR (which measures only the imaginary part of the complex polarizability), it can map both the molecular absorption as well as nanoscale surface plasmon and phonon polaritons making it a truly versatile and reliable near-field optical microscopy technique with the best spatial resolution. [22] Figure 5(a) shows a hexagonal boron nitride (hBN) film whose surface phonon polariton interference patterns have been widely measured by s-SNOM.[25-26] With Vista-IR system from Molecular Vista, both PiFM and s-SNOM measurements can be performed together; images 4(a), 4(b), and 4(c) are topography, s-SNOM, and PiFM images acquired concurrently. For this measurement, the signal-to-noise for PiFM is not quite as high as s-SNOM since the parameters were optimized for s-SNOM for concurrent acquisition; even so the agreement between the two measurement techniques is excellent. Use the QR code in figure 5 to see a video on the advantage of hyPIR imaging for characterizing resonant modes of artificial structures.
Conclusion
IR PiFM provides hyperspectral chemical analysis along with AFM at a scale (~ 5 nm spatial resolution) heretofore unattainable with any techniques on diverse samples including semiconductors, solar cell materials, plasmonics, organics, inorganics, pharmaceuticals, biological specimens (proteins, nucleotides, plants, tissues), 1D/2D materials, and geological specimens.
Acknowledgements
The author wishes to gratefully acknowledge the following collaborators for supplying the samples used in this study; PLA-ACM: Dr. Rudiger Berger from Max Planck Institute of Polymer; AlOx infiltrated into PS-b-PMMA: Dr. Ricardo Ruiz of HGST; pDEGDA-SDIB: Eui Tae Kim and Professor Kookheon Char of Seoul National University; hBN: Dr. Cian Bartlam of University of Manchester.
1] See https://www.eag.com/techniques/ for a chart that compares existing analytical techniques. Not technique offers “chemical bonding/molecular/structural information” at length scale below about 200 nm.
[2] R.M. Stöckle, Y.D. Suh, V. Deckert, and R. Zenobi, Chem. Phys. Lett. 318, 131 (2000).
[3] N. Hayazawa, Y. Saito, and S. Kawata, Appl. Phys. Lett. 85, 6239 (2004).
[4] A. Hartschuh, N. Anderson, and L. Novotny, J. Microsc. 210, 234 (2003).
[5] S. Berweger, J.M. Atkin, R.L. Olmon, and M.B. Raschke, J. Phys. Chem. Lett. 1, 3427 (2010).
[6] N. Jiang, E.T. Foley, J.M. Klingsporn, M.D. Sonntag, N.A. Valley, J.A. Dieringer, T. Seideman, G.C. Schatz, M.C. Hersam, and R.P. Van Duyne, Nano Lett. 12, 5061 (2012).
[7] N. Ocelic, A. Huber, and R. Hillenbrand, Appl. Phys. Lett. 89, 101124 (2006).
[8] M.B. Raschke and C. Lienau, Appl. Phys. Lett. 83, 5089 (2003).
[9] A. Dazzi, R. Prazeres, F. Glotin, and J.M. Ortega, Opt. Lett. 30, 2388 (2005).
[10] A. Dazzi, F. Glotin, and R. Carminati, J. Appl. Phys. 107, 124519 (2010).
[11] A. Dazzi, C.B. Prater, Q. Hu, D.B. Chase, J.F. Rabolt, and C. Marcott, Appl. Spectrosc. 66, 1365 (2012).
[12] F. Lu, M. Jin, and M.A. Belkin, Nat. Photonics 8, 307 (2014).
[13] K. Kjoller, J.R. Felts, D. Cook, C.B. Prater, and W.P. King, Nanotechnology 21, 185705 (2010).
[14] I. Rajapaksa, K. Uenal, and H.K. Wickramasinghe, Appl. Phys. Lett. 97, 073121 (2010).
[15] A. Cvitkovic, N. Ocelic, and R. Hillenbrand, Nano Lett. 7, 3177 (2007).
[16] Z. Fei, A.S. Rodin, G.O. Andreev, W. Bao, A.S. McLeod, M. Wagner, L.M. Zhang, Z. Zhao, M. Thiemens, and G. Dominguez, Nature 487, 82 (2012).
[17] D. Nowak, W. Morrison, H.K. Wickramasinghe, J. Jahng, E. Potma, L. Wan, R. Ruiz, T.R. Albrecht, K. Schmidt, J. Frommer, D.P. Sanders, and S. Park, Sci. Adv. 2, e1501571 (2016).
[18] J. Jahng, J. Brocious, D.A. Fishman, F. Huang, X. Li, V.A. Tamma, H.K. Wickramasinghe, and E.O. Potma, Phys. Rev. B 90, 155417 (2014).
[19] J. Jahng, J. Brocious, D.A. Fishman, S. Yampolsky, D. Nowak, F. Huang, V.A. Apkarian, H.K. Wickramasinghe, and E.O. Potma, Appl. Phys. Lett. 106, 083113 (2015).
[20] B. Kim, J. Jahng, R.M. Khan, S. Park, and E.O. Potma, Phys. Rev. B 95, 075440 (2017).
[21] J. Jahng, E.O. Potma, and E.S. Lee, Anal. Chem. 90, 11054 (2018).
[22] J. Jahng, E.O. Potma, and E.S. Lee, PNAS, 116 (52), 26359 (2019).
[23] M. Hesami and A. Jalali-Arani, J. Appl. Polym. Sci., 134, 45499 (2017).
[24] R. Ruiz, L. Wan, J. Lille, K.C. Patel, E. Dobisz, D.E. Johnston, K. Kisslinger, and C.T. Black, J. Vac. Sci. Technol. B 30(6), 06F202-1 (2012).
[25] S. Dai, Z. Fei, Q. Ma, A. S. Rodin, M. Wagner, A. S. McLeod, M. K. Liu, W. Gannett, W. Regan, K. Watanabe, T. Taniguchi, M. Thiemens, G. Dominguez, A. H. Castro Neto, A. Zettl, F. Keilmann, P. Jarillo-Herrero, M. M. Fogler, D. N. Basov, Science 343, 1125 (2014).
[26] M. Tamagnone, A. Ambrosio, K. Chaudhary, L.A. Jauregui, P. Kim, W.L. Wilson, F. Capasso, Sci. Adv. 4: eaat7189 (2018).