High Resolution Imaging of Particles Dispersed in Polymeric Matrix by True Non-Contact™ Mode Atomic Force Microscopy
- 03 Jan 2020
- Volume 18
- NanoScientific Magazine, Winter 2020
John Paul Pineda, Gabriela Mendoza, Cathy Lee, Byong Kim, and Keibock Lee - Park Systems Inc.
Introduction
Nanoscale materials, or nanoparticles, have received increasingly more research attention as compared to similar macroscale materials because of their unique properties. They include an exceptionally high surface area to volume ratio, and an extensive interface between the matrix and the reinforcement material [1-3]. There are numerous emergent applications that require the dispersion of nanoparticles into a polymeric matrix; the most common of these applications are biomedical sciences, piezoelectric actuators and sensors, microelectronic devices, capacitors and even smart materials [1, 3-5]. Nanoparticles are dispersed into a polymeric matrix to enhance and improve the properties of composite material. For example, the presence of barium titanate (BaTiO3 ) nanoparticles in thermosetting polymer composites enhances the piezoelectric, ferroelectric, and pyroelectric properties of these systems [1]. Incorporating other types of nanoparticles may enhance or improve optical properties, heat resistance or mechanical properties such as stiffness, strength and resistance to wear and damage of the composite materials [2, 6]. Particle and agglomeration size and dispersion of nanoparticles in polymer matrices play a crucial role in describing the ultimate performance of the composite material [2, 6- 8]. Šupová et al. reported that particle agglomerates decrease material performance by the inclusion of voids that act as preferential sites for crack initiation and failure [2]. For this reason, a technique that can generate images of sufficient resolution to visualize particle and agglomeration dispersion, and accurately measure their sizes, is critically important. Atomic Force Microscopy (AFM) is one of the more common methods utilized in previous studies to characterize this type of nanomaterial utilizing a semi-contact or “tapping” mode [9, 10]. In this technique, the tip oscillates near its resonance frequency, allowing the tip to periodically touch the sample surface. According to Hanemann et al., nanoparticles form soft or hard agglomerates depending on the synthesis conditions and the surface chemistry. Soft agglomerates can be degraded into smaller particles by shear forces generated by mechanical stress gradients [5]. Since the tapping mode requires a tip-to-sample interaction, it is possible that the scanning might alter particle distributions of soft agglomerates, and lead to inaccurate data. The True Non-Contact™ imaging mode of AFM systems from Park Systems allows the acquisition of surface topography without the AFM tip touching the sample. The advanced Z scanner design of Park AFM is the key feature in achieving the non-contact imaging performance that defines Park's True Non-Contact mode – producing the best image resolution and accurate topographical data, while maintaining the tip sharpness and minimizing the chance of damaging or altering the sample surface [11]. In this paper, two different samples with nano- and microparticles dispersed in polymeric matrices were studied. High resolution topography images were obtained with accurate measurement and evaluation of particle/agglomerate sizes was done using Park NX10 True Non-Contact™ mode.
Experimental
Two different samples were investigated using a Park NX10 AFM system. The samples were cotton filter-like substances with nano- and micron-sized particles dispersed in a polymeric matrix. Both samples were placed between two flat metal disks. The samples were gently pressed together from both sides of the metal disks to compress and planarize the sample surface. Subjected to gentle finger pressure, the samples were less fluffy and substantially more planar. A silicon tip based cantilever probe was used for the measurement of both samples. The topography of the samples was obtained using the True Non-Contact™ mode of Park Systems. In non-contact mode, the topography image was acquired by measuring the changes in the vibrational amplitude of the cantilever induced by attractive van der Waals forces as the cantilever mechanically oscillated near its resonant frequency during the scan. The measured changes are compensated by the AFM's feedback loop, which maintains a constant cantilever amplitude and distance. Non-contact mode measures the topography of the sample surface by using this feedback mechanism to control the Z scanner movement [12].

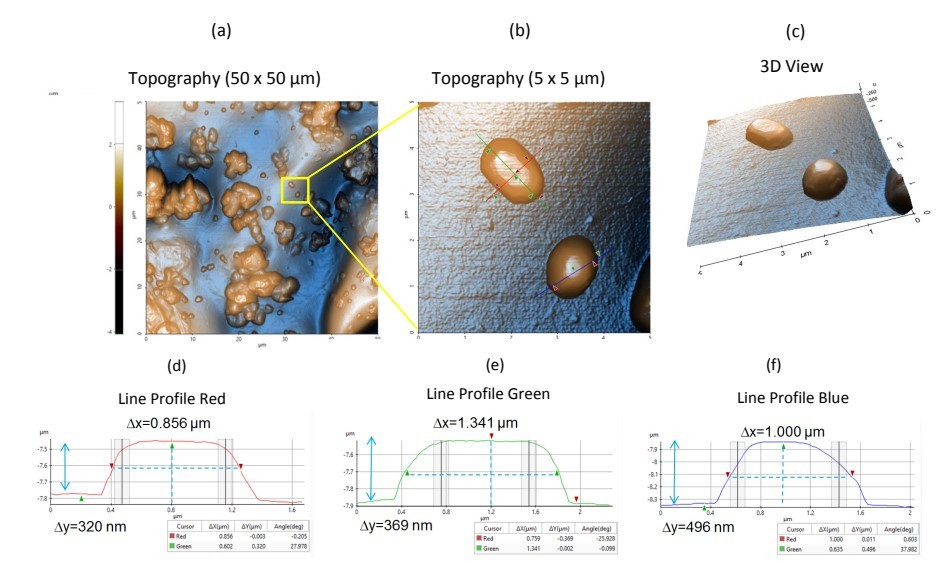
Figure 1. Topography images and line profiles of sample 1. (a) Non-contact topography AFM image. Scan Size: 50 x 50 µm, image size: 512 x 512 pixels. (b) Zoom in view of topography inside the yellow box in Figure 1a. Scan size: 5 x 5 µm, image size: 256 x 256 pixels. (c) Corresponding 3D view of Figure 1b. (d-f) Corresponding line profiles of Figure 1b.
Results and Discussion
Figure 1 shows the topography images acquired from Sample 1. The topography with enhanced color image representations show different features available in the sample surface, which includes the polymeric matrix background, as well as individual and agglomerated particles of varying sizes. The polymeric matrix background of Sample 1 was relatively flat. Also, the particles distributed in the polymer matrix have a variety of sizes with the larger particles potentially composed of agglomerated smaller particles. The small particles range in size from 1–3 µm nominally, while bigger aggregates are approximately 10 microns wide. Figure 1b shows an enlarged section from Figure 1a that features two microparticles, both of which appear to be faceted (i.e., having sides with welldefined shapes). The particle on top has an elongated shape while the bottom particle features a more rounded shape. Both particles have octagonal features with lengths of approximately 1.0 µm and 0.5 µm in height. A line profile analysis was also performed using Park XEI image analysis software to evaluate particle sizes. The equivalent line profiles of Figure 1b are presented in Figures 1d–f. The measured widths of both particles are approximately 0.8–1.4 µm with heights between 0.35–0.5 µm.
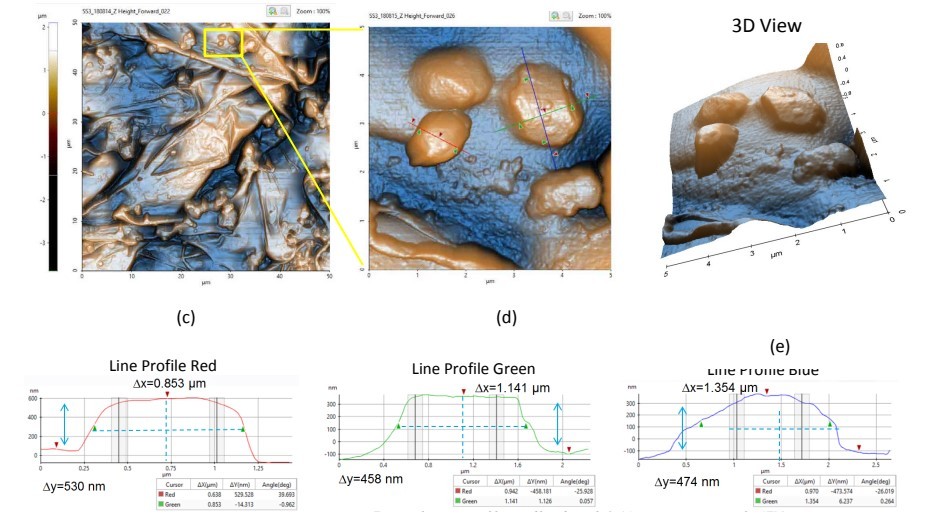
Figure 2. Topography images and line profiles of Sample 2. (a) Non-contact topography AFM image. Scan Size: 50 x 50 µm, image size: 512 x 512 pixels. (b) Zoom in view of topography inside the yellow box in Figure 2a. Scan size: 5 x 5 µm, image size: 256 x 256 pixels. (c) Corresponding 3D view of Figure 2b. (d-f) Corresponding line profiles of Figure 2b.
Figure 2 represents the topography and line profile acquired from Sample 2. This 50 x 50 µm region shows an uneven surface of the polymeric background. Individual particles and agglomerates of varying sizes were also observed. Figure 2b shows an enlarged section from Figure 2a and features four well-defined individual microparticles. Each particle appears to be facetted with hexagonal features, with nominal dimensions of 1.0 µm in length and 0.5 µm in height. The equivalent line profiles from Figure 2b are presented in Figures 2d–f. The measured particle widths were approximately 0.8–1.4 µm, with heights of approximately 0.5 µm.
Grain analysis, the straightforward and simultaneous size quantification of many particles, was also performed using Park XEI software. In grain analysis, the particles selected for size calculation were chosen by adjusting the scroll bar on the Histogram Graph. Table 1 shows detailed information of all grains detected from the NCM topography image from Sample 1 (which is shown in Figure 3). The grain analysis table contains multiple dimensional parameters such as length, area and volume, as well as mean and standard deviation values of tabulated grains. The average size of particles shown in Figure 3 was calculated as 1.390 µm + 0.148 µm. Figure 4 shows the grain analysis data of Sample 2 with a calculated average particle size of 1.492 µm + 0.217 µm. All particles measured in these experiments were in the micrometer range; the lack of individual and detectable nanoscale particles strongly suggests that any nanoscale particles were incorporated into larger agglomerates, or microscale clusters. Nanoscale particles tend to form agglomerates due to the strong and dominant van der Waals forces between them [2].
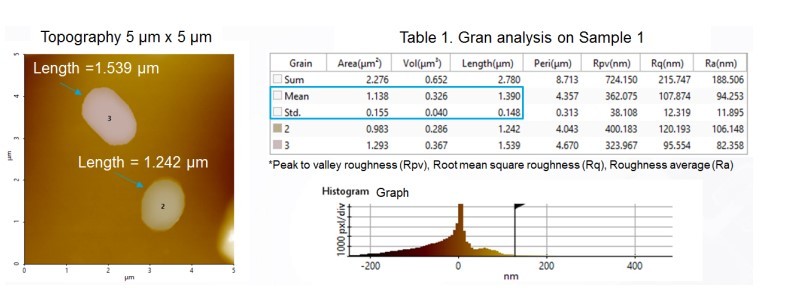
Figure 3. Grain size analysis data of Sample 1.
Conclusion
The particles dispersed in polymeric matrices of two different samples were well characterized using True NonContact™ mode on a Park NX10 AFM system. This technique acquired surface topography without the AFM tip touching the sample, which minimizes the chance of damaging or altering the sample surface. The high resolution images obtained in the experiment allowed the accurate measurement and evaluation of particle sizes and evaluation of particle size and distribution within the polymer matrix.
In summary, the True Non-Contact™ mode provides researchers with the means to characterize sample surfaces on the nanoscale level with high resolution and accuracy, without interference from tip blunting or tipinduced sample damage.
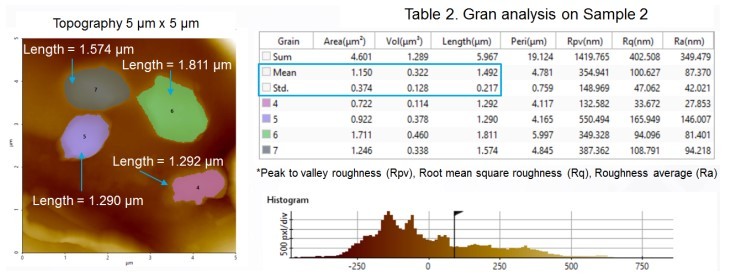
Figure 4. Grain size analysis data of Sample 2
References
1. Asimakopoulos I, et al., Nanocomposites of Barium Titanate Nanoparticles Embedded in Thermosetting Polymer Matrices (Novolac Resin/Unsaturated Polyesters/Epoxy Resin): A Comparative Study. February 2019. DOI: 10.3390/ chemengineering3010012.
2. Šupová M, et al., Effect of Nanofillers Dispersion in Polymer Matrices; A Review. Science of Advanced Materials Vol. 3, 1–25, 2011
3. Okpala C., THE BENEFITS AND APPLICATIONS OF NANOCOMPOSITES. Okpala, International Journal of Advanced Engineering Technology.
4. Corbierre M., et al., PolymerStabilized Gold Nanoparticles and Their Incorporation into Polymer Matrices. J. Am. Chem. Soc., 2001, 123 (42), pp 10411– 10412. DOI: 10.1021/ja016628.
5. Hanemann T., et al., PolymerNanoparticle Composites: From Synthesis to Modern Applications. Materials 2010, 3, 3468-3517; doi:10.3390/ma3063468.
6. Mrlik M., Fillers in advanced nanocomposites for energy harvesting. Fillers and Reinforcements for Advanced Nanocomposites, 2015.
7. Zhang R., Entropy-driven segregation of polymer-grafted nanoparticles under confinement.
8. Schlabach S., et al., Nanoparticles in polymer-matrix composites. Microsystem Technologies February 2011, Volume 17, Issue 2, pp 183–193.
9. RAMAZANOV M., THE MAGNETIC POLYMER NANOCOMPOSITE MATERIALS BASED ON POLYPROPYLENE AND IRON NANOPARTICLES: SYNTHESIS AND STRUCTURE. Journal of Ovonic Research Vol. 12, No. 4, July - August 2016, p. 193 – 200.
10. Tanaka T., et al., Tailoring of Nanocomposite Dielectrics: From Fundamentals to Devices and Applications.
11. Pineda J., et al., True Non-Contact Imaging of Various Samples. Retrieved March 03, 2019, from https://www. parksystems.com/index.php/applications/ life-science/micro-and-molecularbiology/702-true-non-contact-imaging-ofvarious-samples?highlight=WyJqb2huIiwi cGF1bCIsImpvaG4gcGF1bCJd
12. Park AFM Modes and Techniques. (n.d.). Retrieved October 18, 2016, from http:// www.parkafm.com/index.php/park-afmmodes