Electric Force Microscopy of Samples Having an Appreciable Impedance
- 21 Aug 2019
- Volume 16
- NanoScientific Magazine, Spring 2019
Ryan P. Dwyer1,2, John A. Marohn1
Summary
KPFM experiments are used to image capacitance and surface potential in a wide variety of samples. The widely used
KPFM frequency-shift equation rests on assumptions that are questionable in samples having an appreciable impedance
or properties that evolve on a fast timescale. We present new equations describing the cantilever frequency and dissipation in a KPFM experiment carried out on a sample with an appreciable stationary or time-dependent impedance, such as
a photovoltaic film, a battery material, or mixed electronic-ionic conductors.
Article
Scanned probe microscopy (SPM) techniques that measure electrostatic
forces have revealed the fate of charges in a broad array of semiconductor electronic and photovoltaic devices. The equation commonly used to interpret frequency-modulated scanning Kelvin probe force microscopy (KPFM) measurements of electric forces is
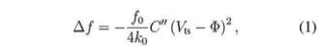
where Δƒ is the time-dependent cantilever frequency shift , ƒ0 is the cantilever resonance frequency, 𝑘0 is the cantilever spring constant, 𝐶″ is the second derivative of the tip-sample capacitance with respect to the vertical direction, 𝑉ts is the applied tip-sample voltage, and Φ is the sample surface potential. Recent experiments have called the validity of this equation into question.
Figure 1 shows one striking example.1 The sample was a thin film of the perovskite semiconductor CsPbBr3 prepared on a conductive indium tin oxide substrate, illuminated from above with visible light (Fig. 1(a)). The cantilever frequency shift and amplitude were measured at diff erent applied tip-sample voltages to determine the curvature of the frequency- and dissipation-versus-voltage parabolas (Fig. 1(b)). Figure 1(c) and (d) show how these parabola curvatures depend on the light intensity.
According to Eq. 1, the curvature of the frequency-shift -versus-voltage parabola is proportional to the tip-sample capacitance derivative 𝐶″, which in turn should be proportional to the free carrier density. In a semiconductor, this free carrier density has a power-law-dependence on the light intensity. The capacitance data, in contrast, increases rapidly but then flattens out as the light intensity is increased. Likewise, the dissipation should increase linearly with the carrier density. The experimental data contradicts this prediction even more dramatically, showing a sharp peak in dissipation at moderate light intensity, and decreasing dissipation at high light intensities, even as the free carrier density surely continues to increase.
The source of these apparent contradictions is not the sample or the microscope, but Eq. 1. The problem lies in two hidden, seldomstated assumptions needed to derive Eq. 1. The two assumptions are
1. the tip charge oscillates exactly in phase with the cantilever motion to keep the tip voltage constant, and
1Department of Chemistry and Chemical Biology; Cornell University; Ithaca, New York 14853
2Department of Chemistry and Biochemistry; University of Mount Union; Alliance, Ohio 44601
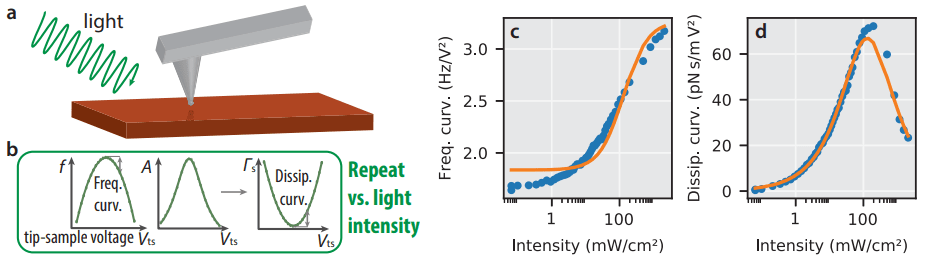
Figure 1. Apparent violation of Eq. 1 in an illuminated thin-film semiconductor, CsPbBr3. Modified from Tirmzi et al., 2017, ACS Energy Lett.; copyright American Chemical Society.1
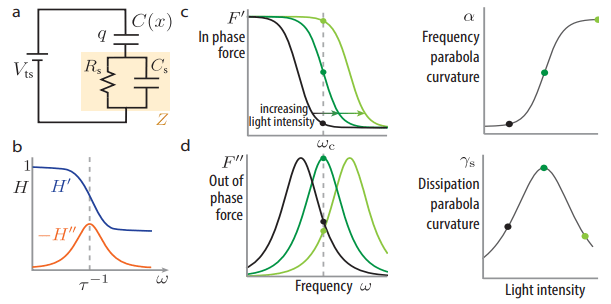
Figure 2. A Lagrangian-impedance treatment of the tip-sample interaction and a parallel-RC model of the sample explains the seemingly anomalous results of Fig. 1. Modified from Tirmzi et al., 2017, ACS Energy Lett.; copyright American Chemical Society.1
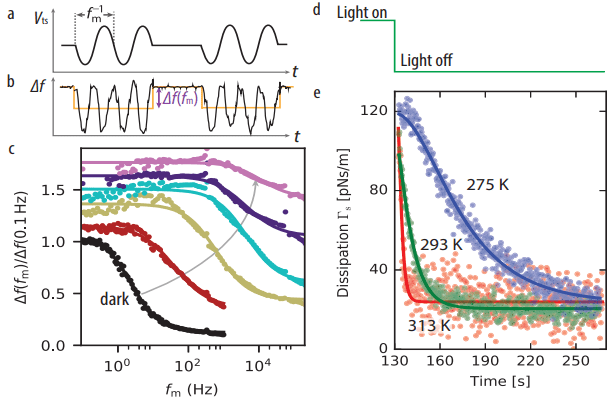
Figure 3. The Lagrangian-impedance model provides a framework for interpreting (a–c) broadband local dielectric spectroscopy, and (d–e) cantilever ringdown dissipation measurements. Modified from Tirmzi et al., 2017, ACS Energy Lett.; copyright American Chemical Society.1
The frequency shift is
![]()
and the sample-induced dissipation is
![]()
with
![]()
two distinct capacitance derivatives, and
![]()
the transfer function between the applied tip-sample voltage and the tip voltage drop, which depends on the tip capacitance 𝐶 and the complex sample impedance 𝑍(ω). These two equations should replace Eq. 1 whenever the tip charge does not oscillate exactly in phase with the cantilever motion.
To explain the data of Fig. 1, we model the sample as a capacitor 𝐶s and light-dependent resistor 𝑅s operating in parallel (Fig. 2(a)). The central new quantity is 𝐻 (ωc ), the transfer function evaluated at the cantilever resonance frequency. Figure 2(b) shows that the transfer function has a roll-off frequency determined by the time constant τ=𝑅s(𝐶+𝐶s)≈𝑅s𝐶s. The real part of the transfer function 𝐻' causes a force 𝐹' oscillating in phase with the cantilever motion which results in a cantilever frequency shift Δƒ (Fig. 2(c)). The imaginary part of the transfer function 𝐻″ causes a force 𝐹″ oscillating out of phase with the cantilever motion which results in sample-induced dissipation — this is the component of the tip-sample interaction completely neglected in Eq. 1 (Fig. 2(d)). We can explain the dramatic peak in dissipation by assuming 𝑅s is large in the dark and small under illumination. The peak in dissipation occurs at an illumination intensity where τ1 equals the cantilever frequency ω0.
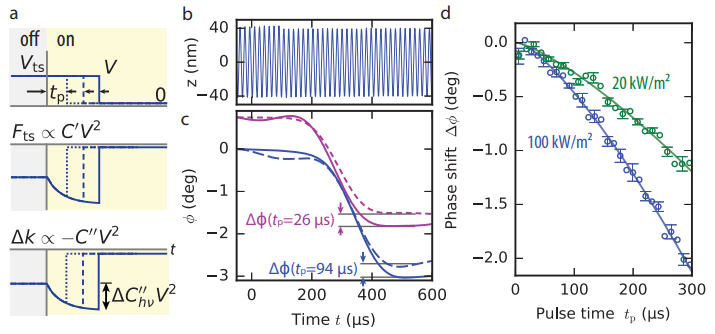
Figure 4. Phasekick electric force microscopy accurately measures light-induced changes in the tip-sample interaction even when the light or voltage induces abrupt changes in the tip-sample interaction, in violation of assumption 2. Modified from Dwyer et al., 2017, Sci. Adv.; copyright American Association for the Advancement of Science, CC BY-NC 4.0.[9]
The lines in Fig. 1(c,d) are a fit of the data to Eqs. 2 and 3. The joint fit nicely captures the nonlinear behavior of both the frequency and the dissipation versus illumination intensity.
This new model of the tip-sample interaction connects and integrates the results of a wide variety of scanned probe experiments. Figure 3(a–c) shows a broadband local dielectric spectroscopy measurement2 carried out on the CsPbBr3 film of Fig. 1. The measured quantity is the difference in cantilever frequency shift caused by modulating the tip-voltage at a frequency ƒm. According to our Lagrangian impedance model, this experiment mainly measures the real part of the transfer function at the modulation frequency 𝐻'(ƒm). The change in the spectrum’s knee with increasing light intensity is in qualitative agreement with the light-dependent 𝑅s used to explain the Fig. 1 data, validating the use of a relatively simple RC sample impedance model to explain a wide range of experiments carried out on the photovoltaic CsPbBr3 sample.
To gain a better understanding of the microscopic origin of this lightdependent
resistance 𝑅s in CsPbBr3, we examined the kinetics of the resistance recovery in the dark at different temperatures. Figure 3(e) shows measurements of the sample-induced dissipation inferred from repeated cantilever ringdown measurements acquired just aft er turning off the light. The increased dissipation, caused by a reduction in the sample resistance 𝑅s, decreases slowly with a time constant ranging from 2 seconds at 313 K to over 30 seconds at 275 K. An Arrhenius plot shows that the process by which the resistance goes back to its dark value is highly activated, with an activation energy Ea=0.52±0.03 eV. This slow, highly activated process rules out many simple explanations of the sample-induced resistance3,4 and supports the suggestion that light creates mobile ionic vacancies in CsPbBr3.5 The Lagrangian-impedance model links each experiment shown in Figs. 1 and 3 back to the sample impedance 𝑍(ω), allowing the experiments to be interpreted in a common framework.
Figures 1–3 show that the Lagrangian-impedance model helps us interpret results when the assumption that the tip charges oscillates exactly in phase with the cantilever is violated (assumption 1). What about the other assumption, that any changes in the tip-sample interaction occur slowly? This assumption can be violated in electric force microscopy (EFM) experiments that follow the time evolution of photocapacitance in response to illumination.6-8 These experiments have pushed the limits of time resolution in electric force microscopy, with claimed time resolutions down to less than 1 percent of the cantilever period.8 Our analysis shows that the standard equation for frequency shift in KPFM cannot be used to analyze these single-shot, transient EFM experiments because the abrupt changes in the tip-sample force shift the cantilever’s amplitude and phase.
Biographical sketches

John Marohn earned a B.S. in Chemistry and a B.A. in Physics from the University of Rochester. His Chemistry Ph.D. research was carried out at the California Institute of Technology under the mentorship of Daniel Weitekamp. He did postdoctoral work at the U.S. Army Research Laboratory with Doran Smith as a U.S. National Research Council Postdoctoral Associate. In 1999 he joined the faculty at Cornell University, where he is presently a Professor of Chemistry and Chemical Biology, serves as his department’s Director of Undergraduate Studies, is a member of the Cornell Center for Materials Research, and is a member of Cornell’s graduate field of Materials Science and Engineering. In 2006, Professor Marohn created the 1st International Conference on nanometer-scale Magnetic Resonance Imaging; the 6th International nano-MRI conference was held in February 2018. In 2012 he landed a Ruth L. Kirschstein National Research Service Award from the National
Institutes of Health that allowed him to work for a year as a visiting scientist at The Scripps Research Institute in La Jolla, California. His research group has three themes: (1) developing a microscopic view of organic and hybrid electronic materials using highsensitivity electric force microscopy, (2) performing nanoscale magnetic resonance imaging using mechanical detection, and (3) studying near-surface fluctuations using microcantilevers.

Ryan Dwyer earned a B.S. in Chemistry from the University of Notre Dame. His chemistry Ph.D. research was performed with John Marohn at Cornell University. He is presently an Assistant Professor of Chemistry and Biochemistry at University of Mount Union where he teaches general and physical chemistry.

Atomic scale view of Perovskite crystal formation. Credit: Matt Klug
The Lagrangian formalism, however, can be used to interpret these results and design experiments that accurately measure abrupt changes in the tip-sample interaction.
The phasekick electric force microscopy experiment sketched in Fig. 4 shows how. The light is turned on at time 𝑡=0, inducing a possibly abrupt change in the capacitance. The voltage is turned to zero abruptly at a time 𝑡p (Fig. 4(a)). We infer the light-induced phase shift as a function of the stepped pulse time 𝑡p (Fig. 4(b)). Representative data at two pulse times is shown in Fig. 4(c). A photocapacitance-induced phase shift is computed by comparing relative phase-shift data in the dark (dashed line) and under illumination (solid line). Figure 4(d) shows representative phase-shift versus pulse-time data acquired for 768 pulse times at two different light intensities over a polymeric solar-cell film. In Ref. 9, analyzing the Fig. 4(d) data revealed that the photovoltaic sample’s photocapacitance had biexponential dynamics.
The Lagrangian-impedance approach to understanding electric force microscopy highlighted here has a number of advantages. It accounts for dissipation of energy in both the sample and the cantilever; treats both steady-state and transient phenomena in a unified way; and captures the effects of sub-cycle changes in sample capacitance, conductivity, and tip charge that are missing from previous treatments of the cantileversampleinteraction in EFM and KPFM. The Lagrangian-impedance point of view has inspired new measurements and has forced us to rethink established measurements. The phasekick EFM measurement of Fig. 4 enables the measurement of sample charge motion on a timescale much shorter than even a single cantilever period. The assumptions underlying Eq. 1 are questionable in many interesting samples. Equations 2 through 4 should be used in place of Eq. 1 in any frequency-modulated KPFM experiment carried out on a sample with appreciable impedance, including photovoltaic films, battery materials, and mixed electronicionic conductors.
Methods
The data in Figs. 1, 3, and 4 were acquired on a custom-built vacuum/variable-temperature scanned probe microscope in Marohn’s laboratory at Cornell.
Acknowledgements
The authors acknowledge financial support from the U.S. National Science Foundation(Grant DMR-1709879).
References
[1] A. M. Tirmzi, R. P. Dwyer, T. Hanrath, and J. A. Marohn, Coupled slow and fast charge dynamics in cesium lead bromide perovskite, ACS Energy Lett., 2017, 2, 488 – 496, URL http://dx.doi.org/10.1021/acsenergylett.6b00722.
[2] M. Labardi, M. Lucchesi, D. Prevosto, and S. Capaccioli, Broadband local dielectric spectroscopy, Appl. Phys. Lett., 2016, 108, 182906, URL http://dx.doi.org/10.1063/1.4948767.
[3] A. M. Tirmzi, J. A. Christians, R. P. Dwyer, D. T. Moore, and J. A. Marohn, Substratedependent photoconductivity dynamics in a high-efficiency hybrid perovskite alloy, J. Phys. Chem. C, 2019, 123, 3402 – 3415, URL http://dx.doi.org/10.1021/acs.jpcc.8b117832019.
[4] R. P. Dwyer, L. E. Harrell, and J. A. Marohn, Lagrangian and impedance spectroscopy treatments of electric force microscopy, Phys. Rev. Appl. (in press), 2019, URL https://arxiv.org/abs/1807.01219.
[5] G. Y. Kim, A. Senocrate, T.-Y. Yang, G. Gregori, M. Grätzel, and J. Maier, Large tunable photoeffect on ion conduction in halide perovskites and implications for photodecomposition, Nat. Mater., 2018, 17, 445 – 449, URL http://dx.doi.org/10.1038/s41563-018-0038-0.
[6] D. C. Coffey and D. S. Ginger, Time-resolved electrostatic force microscopy of polymer solar cells, Nat. Mater., 2006, 5, 735 – 740, URL http://dx.doi.org/10.1038/nmat1712.
[7] R. Giridharagopal, G. E. Rayermann, G. Shao, D. T. Moore, O. G. Reid, A. F. Tillack, D. J. Masiello, and D. S. Ginger, Submicrosecond time resolution atomic force microscopy for probing nanoscale dynamics, Nano Lett., 2012, 12, 893 – 898, URL http://dx.doi.org/10.1021/nl203956q.
[8] D. U. Karatay, J. S. Harrison, M. S. Glaz, R. Giridharagopal, and D. S. Ginger, Fast time-resolved electrostatic force microscopy: Achieving sub-cycle time resolution, Rev. Sci. Instrum., 2016, 87, 053702, URL http://dx.doi.org/10.1063/1.4948396.
[9] R. P. Dwyer, S. R. Nathan, and J. A. Marohn, Microsecond photocapacitance transients observed using a charged microcantilever as a gated mechanical integrator, Sci. Adv., 2017, 3, e1602951, URL http://dx.doi.org/10.1126/sciadv.1602951.