Molecular Vibrational Based Surface Sensitive Imaging – Sum Frequency Generation (SFG) Microscopy with Compressive Sensing (CS) Technique
- 03 Jan 2020
- Volume 18
- NanoScientific Magazine, Winter 2020
Hao Li and Steven Baldelli
Department of Chemistry University of Houston Houston, TX 77204-5003

HAO LI
received his bachelor’s degree in chemistryat Nanjing University in 2015.
While there, he studied surface enhanced infrared spectroscopy with Prof. Xinghua Xia.
From 2015, Hao Li joined Dr. Steven Baldelli’s group. His research topic isto study CO-Pt electrode interface using compressive sensing sumfrequency generation microscopy combined with electrochemistry.
 STEVEN BALDELLI
is a professor of chemistry at the University of Houston. He received his BS in chemistry at Framingham State College in Framingham, Massachusetts and Ph.D. in chemistry from Tufts University with Mary Shultz.
His postdoctoral work was at the
University of California, Berkeley with Gabor Somorjai and Phil Ross. Since at the University of Houston, his research has focused on; surface chemistry of ionic liquids, corrosion an inhibition of metals, electrocatalysis, surface adsorption, electrochemistry, and nonlinear optical microscopy.
Introduction
SFG is a second order nonlinear optical process. Compared with other vibrational
spectroscopy techniques such as Infrared and Raman, SFG are widely applied to study interface systems due to its high surface selectivity. This property makes
it useful into microscopy applications to map the molecular vibrational contrast of the interfaces. From the process first observed in 1980s1, 2, SFG is developed to study complex interface systems such as monolayer on metal surfaces3-6 and biomaterials system7. However, the low signal intensity and long acquisition time are two main limitations for good imaging results.
To reduce the data acquisition time,the sampling process of SFG microscopy is
combined with Compressive Sensing (CS) technique, which requires fewer samples or measurements than Nyquist–Shannon sampling theorem8-10. Meanwhile, the CS microscopy technique maintains higher intensity of each single measurement compared to scanning microscopy techniques because each measurement samples half of the image. Therefore it results in a high imaging speed with good image quality. With the CS technique, the broadband spectroscopic SFG system is able to apply on studying the complex molecular mixture on the interface.
SFG Spectroscopy
SFG is a surface sensitive technique that provides information about the vibrational modes of molecules at the interface. SFG process occurs when two pulsed laser beams, an infrared (IR) and a visible, spatially and temporally overlap at an interface11as shown in figure 1. Their interaction with the material produces an SF beam, whose frequency equals the sum of the two incident frequencies, i.e.,.
ωSF=ωIR+ωvis
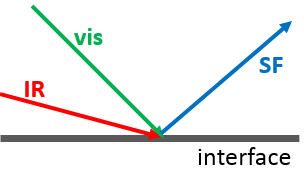
Figure 1 - SFG beam diagram
The relationship between the intensity of the SF beam and the electric fields of the two incident beams is given by:
I SF∝|χ(2):EIR Evis | 2
Where χ(2) is the second-order nonlinear susceptibility12.As a third rank tensor, the value of χ(2) equals zero for centrosymmetric systems2. As a result, SFG process only occurs at interface, which breaks the centrosymmetric compare to bulk volume.
CS-SFG microscopy
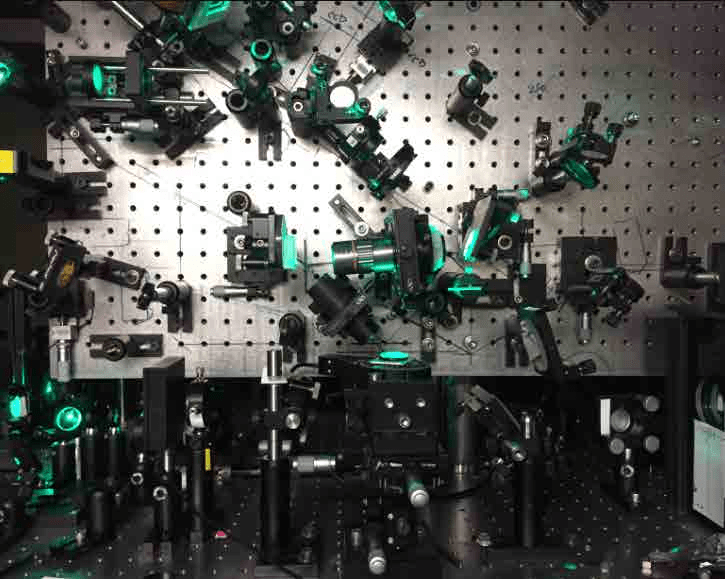
Figure 2 - SFG microscope setup
In figure 3, CS-SFG microscopy setup, one visible beam (green line, 513 nm) irradiates at 45 degrees while one broadband IR beam (red line) irradiates at 75 degrees13, 14. After reaching spatial and temporal overlap on sample surface, the generated SF beam (blue line) is split by the spectrometer and detected by the CCD array.
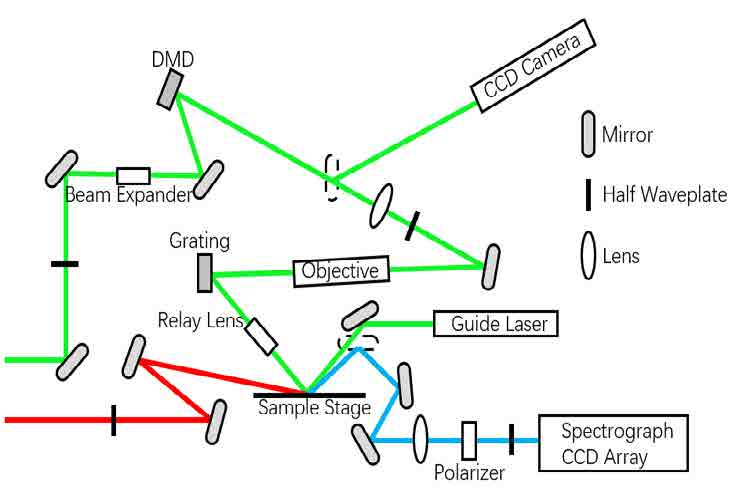
Figure 3 - Scheme of SFG microscope optics diagram
The digital mirror device (DMD) is applied to form a random 2D pattern structural visible beam.
The imaging reconstruction process shown in figure 4 is based on the spectroscopicinformation obtained from CCD array related to the structural visible beam from each DMD pattern. Compared to single wavenumber camera detector, the CS technique has the advantage to apply broadband system to acquire more completemolecular information, for example the entire C-H vibrational modes range, with increasing efficiency of imaging.
Compressing Ratio Influence on Image Quality
The CS technique is based on the fact that significant signals in nature are
sparse. Therefore, the majority of information of the images comes from a small part of the signal with large coefficients. Measuring only the signals with high coefficients, compressed sampling is achieved. That is, less measurements compare to usual imagingprocess is capable of revealing most of the information in the images.
A striping self-assemble monolayer (SAM) sample was tested to examine the effect of the compressing ratio to the image quality15.3 mM 1-octadecanethiol (ODT) ethanol solution was stamped on the gold evaporated silicon wafer by a homemade striping PDMS stamp. The exposed gold surface was then etched to form ODT SAM on gold stripes sample. The sample was tested with the IR beam focused at 2880 cm-1.
The figure 5 shows the reconstruction SFG images with various number, 20%, 40%, 60%, 80% and 100%, of the total 1024 DMD patterns, which is the total number of patterns available to 32 × 32 pixels. From the result, the stripes pattern become
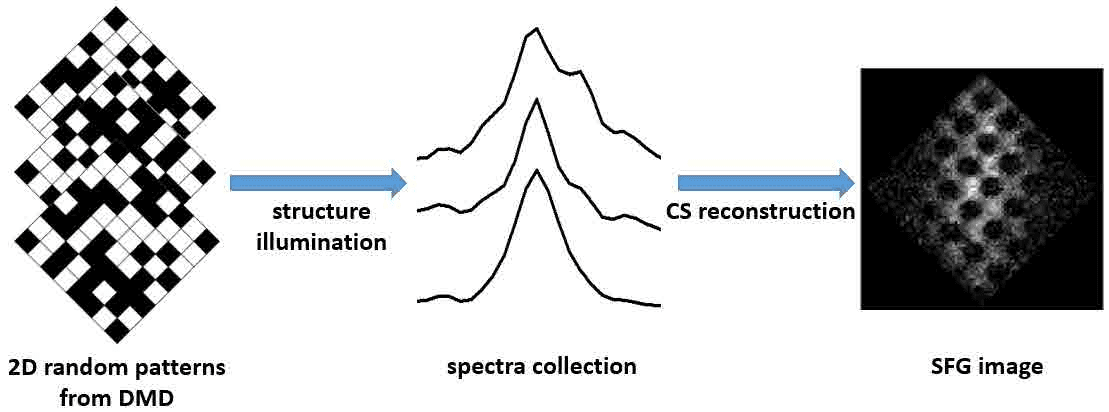
Figure 4 - CS-SFG imaging process
clearer with the increasing number of patterns. And with 40% of the available patterns, the image is clear enough to provide the stripes information. Therefore, by keeping most of the information for a clear enough image, imaging process can be compressed. Based on this advantage, shorter acquisition time is needed for each imaging process, which makes it possible to monitor the surface condition changes in a small time scale. As to application,the SFG microscopy can be used to monitor the kinetics of the surface reactions, such as the wetting process of liquid on solid surface, which finishesin a relative short time.
Structural Hyperspectral Imaging of Self-Assembled Monolayers (SAMS)
SFG microscopy is a hyperspectral imaging process that reveals not only the surface morphology, but also the chemical information within surface area. This feature makes SFG useful in studying the spatial-chemical distribution on the surface. Microcontact printing is an often used technique to form patterns of SAMS on substrate whose domains follows the PDMS stamp structure. Alkanethiol molecules are widely studied in surface chemistry. Studying how the SAMS of alkanethiol molecules distribute and
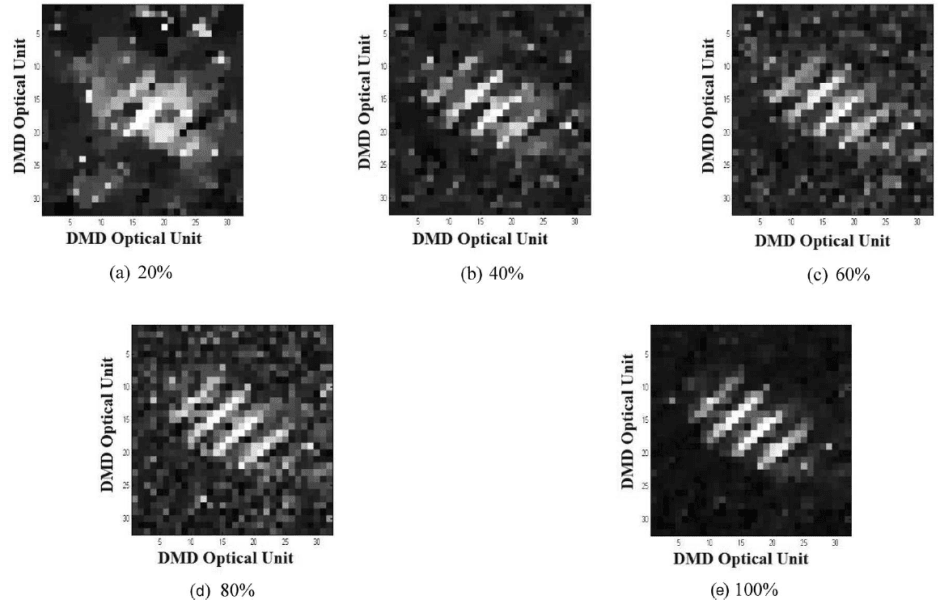
Figure 5 Effect of number of patterns on SFG imaging quality15
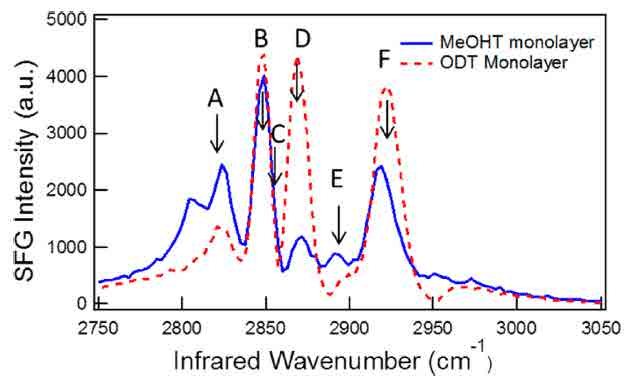
Figure 6 - SFG spectra of ODT and MeOHT14.
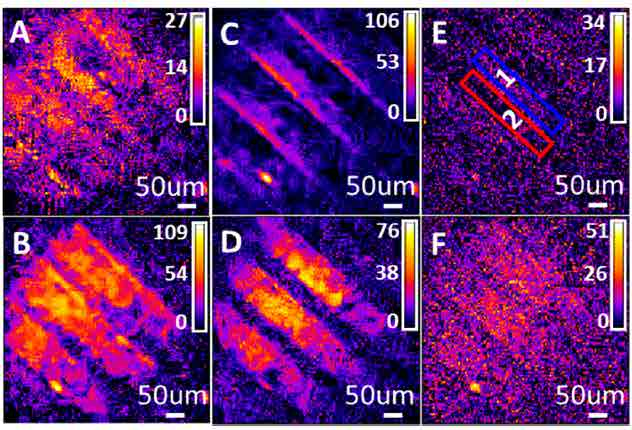
Figure 7 - SFG images of ODT and MeOHTstripe pattern mixture14
influence the surface property can be interesting especially in some metal corrosion problems16. In SFG microscopy, the alkanethiol molecules distribution is studied by focusing the IR at C-H vibrational range. 1-octadecanethiol (ODT) and 16-methoxy-1-hexadecanethiol (MeOHT) mixture are studied here with stripe patterns14. Figure 6 shows the SFG spectra of pure molecules. By setting the IR wavenumber to match the vibrational modes, these two molecules can be distinguished due to the difference in their spectra.
From the SFG spectra of the two molecules, ODT has higher intensity at peak position B, D and F while MeOHT is higher at peak A and E. The reconstruction SFG images shown as figure 7 match the spectra result that when IR wavenumber is set at B, D and F peak wavenumber positions, the brighter stripes are located at region 1 shown in image E while image A and C have brighter stripes in region 2. The comparison between the SFG spectra from region 1 and 2 with the pure chemicals in figure 8 shows that MeOHT and ODT are located within these two stripe areas separately. The result proved that SFG microscopy can be used as a reliable imaging technique to observe not only the surface morphology but also the chemical information distribution.
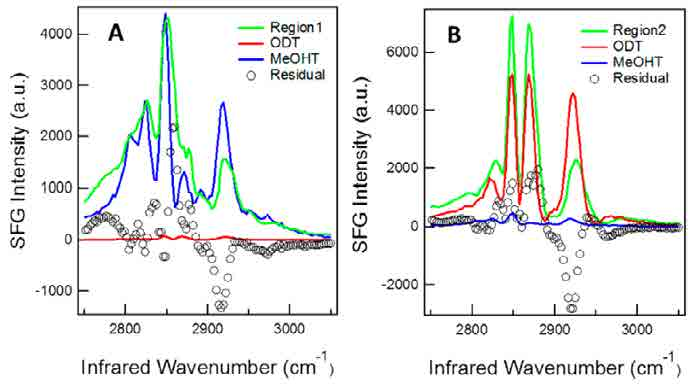
Figure 8 Comparison of SFG spectra from region 1 and 2 with pure ODT and MeOHT14
Surface Adsorbed Molecules Orientation Study
As a three photon nonlinear optical process, the different polarizations combination of the three beams is applied to study the orientations of the surface adsorbed molecules. SSP polarization, for example, represents for S-, S-, and P- polarized output SF beam, input visible beam and input IR beam. From the C-H peaks assignment of the SFG spectrum, the geometry of methyl or methylene group can be determined. The tilt angle of the alkane chain can be
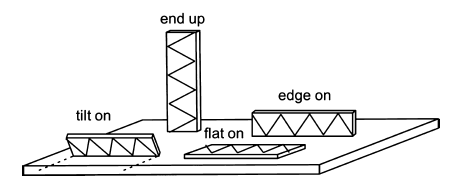
Figure 9 Scheme of possible molecules adsorption modes20
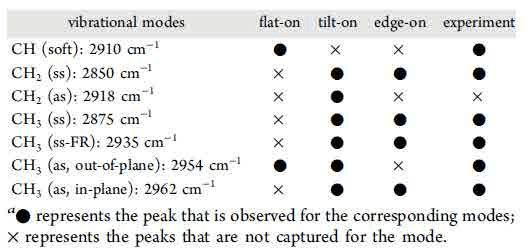
Table 1 Peak comparison between experimental and theoretical results20
calculated by the ratio of peak intensity from different polarization combinations. Besides SAMS, SFG can be applied to study more complex system such as the wetting process. The natural spreading process of long-chain alkanes on metal interface is widely studied because of its potential applications such as lubrication17,18 or corrosion protection19. Dip-coating is a reliable method to simulate the natural wetting process at solid-liquid or solid-air interface.
Dotriacontane (DTC, n-C32H66) molecule films on polycrystalline gold surface
system is studied20. Compared with SAMS system, part of the surface from dip-coating process is covered in homogeneously with either incomplete layers or multilayers. Combined with SFG microscopy technique, those in homogeneous distributions can be revealed from the domain structure in SFG images.
More details about the molecules orientation can be determined by locating the SFG spectra information into the functional group of the molecule. If the all-transalkyl chain is not parallel to the surface, the local centrosymmetry
between the two adjacent -CH2 vibrations results in no -CH2 peaks assignment by the SFG selection rule. Therefore, any observed -CH2 peak can be a proof of the broken of local centrosymmetry, that is, a gauche conformation of the
alkyl chain. Based on this, SFG spectroscopy information can reveal the molecules adsorption modes, such as flat-on21-24, tilt-on25, 26 or edge-on27-31, compared with the theoretical peaks assignment21-31in table 1. In other words, by setting the IR wave number at the unique peak belongs to different modes, the highlight areas shown in SFG image represent the molecules with specific adsorption modes.
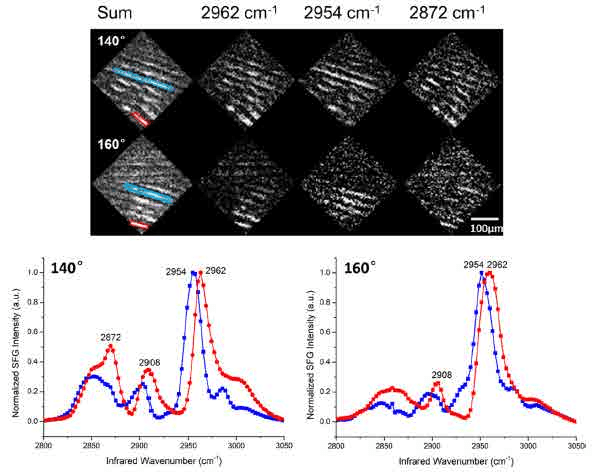
Figure 10SFG images of different vibrational modes under different azimuthal angles. The spectra of the blue and red box areas were generated below20
Besides the adsorption modes, the orientation angle of the molecules within the same adsorption mode domain is another important property that can be studied by SFG microscopy. The SFG images were generated by summing over the wavenumber channels of entire C-H region to reveal the surface morphology in general. From the SFG image with the sum of C-H range vibrational modes in figure 10, the molecules are stripes structure after a dip-coating process. And the SFG spectra within one particular stripe suggest that the molecules not only belong to one adsorption mode but a combination.
To determine the molecular in-plane orientation of different adsorption modes within one stripe, the surface anisotropy diagram as figure 11is measured here by rotating the sample surface with different azimuthal angle. Basically, the geometry of the molecules with different adsorption modes belong to different symmetry point group, which has unique rotational representations. For example, flat-on mode molecules are C2 conformation with a twofold rotation axis along z-direction while edge-on mode molecules are Cs symmetry with a symmetry mirror normal to x-y plane. By setting the IR wavenumber at 2908 cm-1, the methylene group stretching mode as the unique peak for flat-on mode, the anisotropy diagram shows reasonable symmetry structure. By measuring the azimuthal angle value with maximum SFG intensity at 2908 cm-1, the rotation axis of C2 conformation can be determined, which represents for the orientation of the flat-on mode compare to the dip-coating direction. As a result, the details of how the DTC molecules adsorb on substrate, including the adsorption mode and the orientation, can be revealed from the SFG images
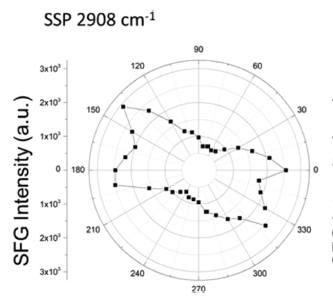
Figure 11 Polar plots of the intensity for methylene group stretching mode20
Aqueous System - Electrochemistry Stud
Based on the features of CS-SFG microscopy mentioned above that we can observe the surface chemical domains and calculate the molecules behavior such as the orientations, it can be applied to more complex systems where other techniques are not available.
Another topic our group is focusing on is to test how the electrochemistry reactions happen on electrode surface in aqueous system. Most of the research focuses on using spectroscopy method to study the single crystal electrode surface, which signal only comes from the homogenous surface. However, for other natural polycrystalline electrodes, the spectroscopy cannot acquire the contribution from different crystal surfaces, especially some boundary or step conditions. SFG microscopy can be applied here to monitor the electrochemistry reactions process on different crystal surfaces and reveal the molecules’ behaviors on boundary or step areas. Meanwhile, due to the surface selectivity, the thin electrolyte film within the beam path has no contribution to the SFG signal, which makes SFG not influenced by the bulk liquid phase. All of the features of SFG microscopy make it possible for an in-situ study of the molecules distribution on polycrystalline electrode surface.
CO-Pt electrode interface, as a widely studied system, was tested as an example for the SFG microscope. The hydrogen flame annealing treatment lets the Pt electrode surface form domain structures with clear boundaries shown in figure 12. By holding the potential of Pt at -0.15 V vs. Ag/AgCl in CO saturated 0.1 M H2SO4 electrolyte, CO gas molecules were adsorbed on Pt surface. The potential applied on Pt working electrode was then changed by potentiostat to examine the CO adsorption behaviors at different potentials. IR wavenumber was set near 2080 cm-1 to measure the C-O stretching mode on top site of Pt. The wavenumber distribution was mapped with nonlinear fitting program though Mathematica as figure 13. From the mapping result, the wavenumber of the C-O stretching has a blue shift with an increasing potential following the stark shift effect. Meanwhile, part of the CO signal disappears at 0.50 V vs. Ag/AgCl, which indicates the CO molecules adsorbed on the bottom two domains were oxidized and desorbed at higher potential. That is, SFG microscopy is able to show the difference of oxidation potential of CO on different surface domains, which cannot be revealed by average spectroscopy technique.
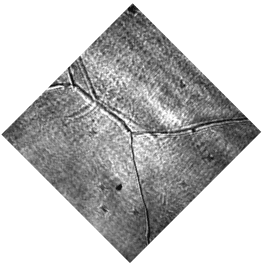
Figure 12 Optical image of polycrystalline Pt electrode surface
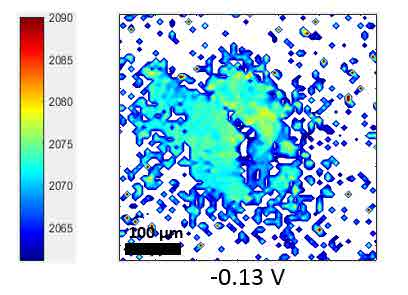
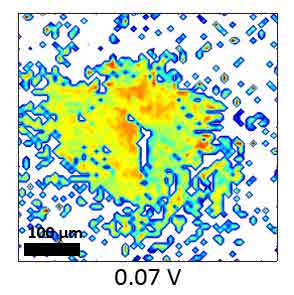
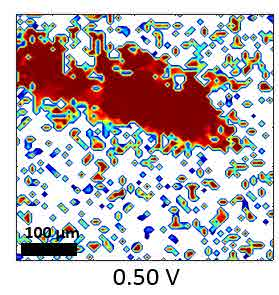
Figure 13 Fitting SFG wavenumber images of CO adsorption on Pt electrode at different potential vs. Ag/AgCl
Conclusion
SFG microscopy is a powerful technique for surface science due to its unique
surface selectivity feature. It can be applied to distinguish the molecules distribution of the mixture on the surface. Based on SFG spectroscopy, the orientation and the adsorption mode can be measured. For more complicated system, for example the solid-liquid electrode surface, SFG microscopy has its advantages for in-situ study. Combined with CS technique, the imaging process of SFG microscopy can be compressed, which allows to capture the fast reaction process for solving dynamics problem.
Acknowledge
The project is supported by W.M. Keck Foundation and NSF CHE 1610453. This project is collaboration with Professor Kevin F. Kelly and his group at Rice University. The compressive sensing technique and the imaging reconstruction codes are developed with his group. The Authors are indebted to Dr. Desheng Zheng for the construction of this microscope.
References
(1) Hunt, J. H.; Guyot-Sionnest, P.; Shen, Y. R. Observation of C-H Stretch Vibrations of Monolayers of Molecules Optical Sum Frequency Generation. Chem. Phys. Lett.1987, 133, 189−192.
(2) Zhu, X. D.; Suhr, H.; Shen, Y. R. Surface Vibrational Spectroscopy by Infrared-Visible Sum Frequency Generation. Phys. Rev. B: Condens. Matter Mater. Phys. 1987, 35, 3047−3050.
(3) Cimatu, K. A.; Baldelli, S. Chemical Microscopy of Surfaces by Sum Frequency Generation Imaging. J. Phys. Chem. C2009, 113 (38), 16575−16588.
(4) Cimatu, K.; Baldelli, S. Sum Frequency Generation Microscopy of MicrocontactPrinted Mixed Self-Assembled Monolayers. J. Phys. Chem. B2006, 110 (4), 1807−1813.
(5) Fang, M.; Baldelli, S. Grain Structures and Boundaries on Microcrystalline Copper Covered with an Octadecanethiol Monolayer Revealed by Sum Frequency Generation Microscopy. J. Phys. Chem. Lett. 2015, 6 (8), 1454−1460.
(6) Fang, M.; Santos, G.; Chen, X.; Baldelli, S. Roles of Oxygen for Methanol Adsorption on Polycrystalline Copper Surface Revealed by Sum Frequency Generation Imaging Microscopy. Surf. Sci.2016, 648, 35−41.
(7) Raghunathan, V.; Han, Y.; Korth, O.; Ge, N.; Potma, E. O. Rapid Vibrational Imaging with Sum Frequency Generation Microscopy. Opt. Lett. 2011, 36 (19), 3891−3893.
(8) Candes, E.; Romberg, J. Sparsity and Incoherence in Compressive Sampling. Inverse Problems2007, 23 (3), 969−985.
(9) Romberg, J. Imaging via Compressive Sampling [Introduction to Compressive
Sampling and Recovery via Convex Programming]. IEEE Signal Processing Magazine2008, 25 (2), 14−20.
(10) Baraniuk, R. G. Compressive Sensing. IEEE signal processing magazine2007, 24 (4).11810.1109/MSP.2007.4286571.
(11) Bain, C. D. Sum-Frequency Vibrational Spectroscopy of The Solid/Liquid Interface. J. Chem. Soc., Faraday Trans. 1995, 91 (9), 1281−1296.
(12) Shen, Y. Surface Properties Probed by Second-Harmonic and Sum-Frequency Generation. Nature1989, 337, 519−525.
(13) Zheng, D.; Lu, L.; Li, Y.; Kelly, K. F.; Baldelli, S. Compressive Broad-Band Hyperspectral Sum Frequency Generation Microscopy to Study Functionalized Surfaces. J. Phys. Chem. Lett. 2016, 7, 1781− 1787.
(14) Zheng, D.; Lu, L.; Kelly, K. F.; Baldelli, S. Chemical Imaging of Self-Assembled Monolayers on Copper Using Compressive Hyperspectral Sum Frequency Generation Microscopy. J. Phys. Chem. B2017, 122, 464−471.
(15) Cai, X.; Hu, B.; Sun, T.; Kelly, K. F.; Baldelli, S. Sum Fequency Generation-Compressive Sensing Microscope. J. Chem. Phys. 2011, 135 (19), 194202.
(16) Santos, G. M.; Baldelli, S. Monitoring Localized Initial Atmospheric Corrosion of Alkanethiol-Covered Copper Using Sum Frequency Generation Imaging Microscopy: Relation between Monolayer Properties and Cu 2O Formation. J. Phys. Chem. C2013, 117 (34), 17591 −17602.
(17) Gellman, A. J. Vapor lubricant transport in MEMS devices. Tribol. Lett. 2004, 17, 455−461.
(18) Wasan, D. T.; Nikolov, A. D. Spreading of nanofluids on solids. Nature2003, 423, 156−159.
(19) Felhösi, I.; Kalma ́n, E.; Po ́czik, P. Corrosion protection by self-assembly. Russ. J. Electrochem. 2002, 38, 230−237.
(20) Sun, Z.; Zheng, D.; Baldelli S. Study of the Wetting of Paraffin Films on the Metal Surface in the Dynamic Dip-Coating Process Using Compressive-Sensing Sum Frequency Generation Microscopy. J. Phys. Chem. C2018, 122, 26543−26553.
(21) Uosaki, K.; Yamada, R. Formation of twodimensionalcrystals of alkanes on the Au (111) surface in neat liquid. J. Am. Chem. Soc. 1999, 121, 4090−4091.
(22) Xie, Z. X.; Xu, X.; Mao, B. W.; Tanaka, K. Self-assembled binary monolayers
of n-alkanes on reconstructed Au (111) and HOPG surfaces. Langmuir2002, 18, 3113−3116.
(23) Zhang, H.-M.; Xie, Z.-X.; Mao, B.-W.; Xu, X. Self-assembly of normal alkanes on the Au (111) surfaces. Chem. Eur. J. 2004, 10, 1415−1422.
(24) Yoshimura, D.; Ishii, H.; Ouchi, Y.; Ito, E.; Miyamae, T.; Hasegawa, S.; Okudaira, K. K.; Ueno, N.; Seki, K. Angle-resolved ultraviolet photoelectron spectroscopy and theoretical simulation of a well-ordered ultrathin film of tetratetracontane (n-C44H90) on Cu (100): Molecular orientation and intramolecular energy-band dispersion. Phys. Rev. B: Condens. Matter Mater. Phys. 1999, 60, 9046−9060.
(25) Endo, O.; Nakamura, M.; Amemiya, K.; Ozaki, H. Compression Induced Conformation and Orientation Changes in an n-Alkane Monolayer on a Au (111) Surface. Langmuir2017, 33, 3934−3940.
(26) Yamamoto, M.; Sakurai, Y.; Hosoi, Y.; Ishii, H.; Kajikawa, K.; Ouchi, Y.; Seki, K. Structures of a Long-Chain n-Alkane, n-C44H90, on a Au(111) Surface: An Infrared Reflection Absorption Spectroscopic Study. J. Phys. Chem. B2000, 104, 7363−7369.
(27) Bagus, P. S.; Weiss, K.; Schertel, A.; Wöll, C.; Braun, W.; Hellwig, C.; Jung, C.
Identification of transitions into Rydberg states in the X-ray absorption spectra of condensed long-chain alkanes. Chem. Phys. Lett. 1996, 248, 129−135.
(28) Marchenko, O.; Cousty, J. Molecule length-induced reentrant self-organization of alkanes in monolayers adsorbed on Au (111). Phys. Rev. Lett. 2000, 84, 5363−5366.
(29) Marchenko, A.; Lukyanets, S.; Cousty, J. Adsorption of alkanes on Au (111): Possible origin of STM contrast at the liquid/solid interface. Phys. Rev. B: Condens. Matter Mater. Phys.2002, 65, 045414.
(30) Rabe, J. P.; Buchholz, S. Commensurability and mobility in twodimensional molecular patterns on graphite. Science1991, 253, 424−427.
(31) Morishige, K.; Takami, Y.; Yokota, Y. Structures of alkanes and alkanols adsorbed on graphite in solution: Comparison with scanning tunneling-microscopy images. Phys. Rev. B: Condens. Matter Mater. Phys. 1993, 48, 8277−8281.
