Electrochemical AFM (EC-AFM): In Situ Monitor of Copper Deposition/Dissolution on Gold
- 01 Feb 2020
- Volume 19
- NanoScientific Magazine, Spring 2020
Jiali Zhang, Ben Schoenek, Byong Kim and Keibock Lee, Park Systems Inc., Santa Clara, CA USA

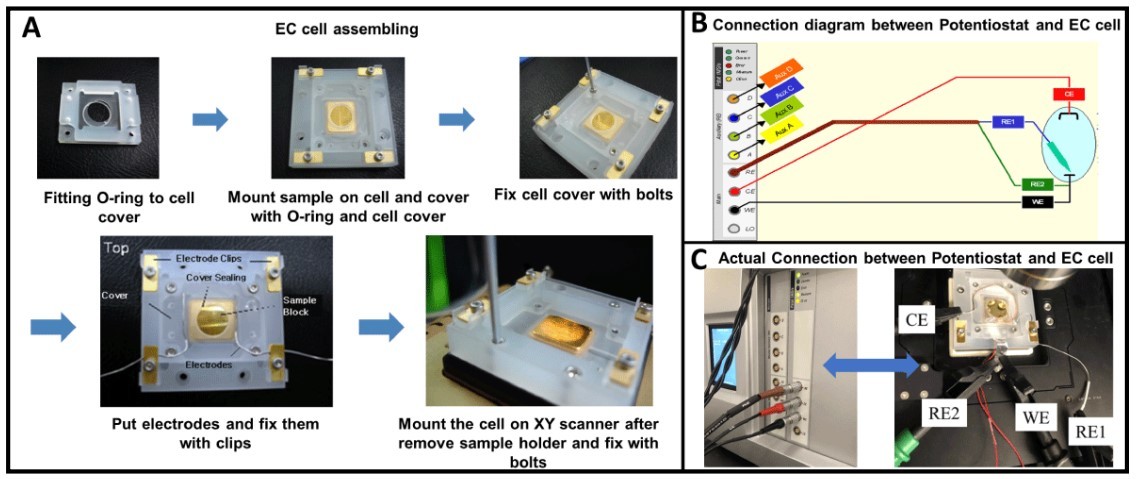
Figure 1. Experimental setup: (A) A step-by-step guide to assemble an EC cell before mounting to the Park AFM system; (B) Schematic diagram showing how to connect the potentiostat with the assembled EC cell; (C) Close-up of Au (111) working electrode mounted inside an EC cell and fixed on a Park NX12 stage while connected to the potentiostat following the above diagram.
Introduction
Electrodeposition is emerging as a popular way to fabricate electronic nanostructures on a surface [1, 2]. Understanding and controlling this process at nanoscale has been a long-standing challenge in electrochemistry. Atomic force microscopy (AFM) has proven to be a versatile tool to characterize and manipulate surface features with nanometer resolution. Researchers are therefore motivated to combine electrochemical experiments and AFM technology into electrochemical AFM (EC-AFM). This combination allows the researcher to perform in situ analysis, and control the electrochemical reactions at solid-liquid interfaces [3-5]. This technique has been used in applications as varied as battery studies [5-7], metal corrosion [8, 9], biosensor development [10], and more.
This study shows the investigation of localized electrochemical deposition and dissolution of copper using EC-AFM. In the study, a Park NX12 AFM system is equipped with a three-electrode electrochemical cell (EC cell) connected to a potentiostat. A conductive Au (111) surface is used as a working electrode (WE) where the electrochemical reaction takes place. The deposition process, at low potential, and dissolution, at high potential, are shown to be fully reversible, rapidly – within one AFM scan line. This simultaneous topographic image and electrochemical response was recorded. Our results demonstrate that EC-AFM can be used for monitoring the in situ electrodeposition process and also obtain insight into controlled additive nano-fabrication of an EC reaction at the solid-liquid interface.
Experimental
A Park NX12 was used to monitor the deposition and dissolution of copper on an Au surface. The measurement principles and major parts of the EC-AFM setup are similar to using AFM in liquid. A non-conductive probe (CONTSC cantilever with spring constant of 0.2 N/m) was employed and mounted on a Teflon chip carrier, which was mounted onto a liquid probehand designed by Park Systems. This setting ensures that it does not interfere with the electrochemical reaction. All of the AFM topographic images shown were characterized using contact mode in electrolyte solution, using a force of 5 nN and a scan rate of 0.5 Hz.
Au (111) on mica was mounted in an EC cell made of Polychlorotrifluoroethylene (PCTFE), manufactured by Park Systems. The substrate was mounted with a top cover and securely sealed with a thin, silicon O-ring to prevent leaking, following the step-by-step procedure shown in Figure 1A. After the EC cell was well assembled, the electrode cables were connected between the potentiostat (Solartron Modulab XM, Ametek Solartron, UK) and the EC cell based on the connection diagram (Figure 1B). Three cables were connected: WE, reference electrode (RE) and counter electrode (CE). In this study, a silver chloride electrode (Ag/AgCl) is used as the RE which keeps the potential between itself and the working electrode constant. Typically, Platinum-Iridium (Pt-Ir) wires can be used as the CE. Here Cu wire acted as the CE due to its excellent malleability. When the WE area is bigger than the CE area, a signal saturation error occurs in the potentiostat. Typically, the CE was reshaped into a ring to increase the CE area, as shown in Figure 1C. All of the electrodes were isolated from each other. After the experimental setup was ready, an electrolyte solution (20 mM CuSO4 ) immersed the electrodes inside the EC cell.

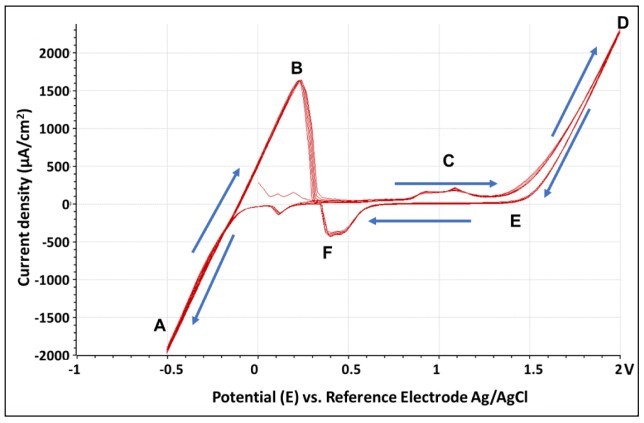
Figure 2. Cyclic voltammograms: The CV curve was taken with an Au electrode mounted in a Park AFM EC cell measured in 20 mM CuSO4 solution.
After the cell was assembled, the cyclic voltammetry (CV) technique was employed to investigate the electrochemical reaction mechanisms. These mechanisms give rise to electroanalytical current signals by applying a voltage to the CE immersed in electrolyte solution. The cyclic voltammograms generated from the software are displayed as the curve for the current vs. the potential for a linear potential sweep. The sweep of CV was set to -0.5 V to 2 V, with a sweep rate of 100 mV/s for ten cycles. Current density was calculated using the geometric area of the electrode by the Modulab ECS software. CV measurement was used to understand and control the redox reaction.
Results and Discussion
A reversible CV curve was generated after successful setup. Based on the cyclic voltammogram generated (Figure 2), as the potential was scanned positively from point A to point D, the oxidation reaction (dissolution of copper) occurred. When the switching potential (D) was reached, the scan direction was reversed (from D to F), and the potential was scanned in the negative direction where the reduction reaction occurred. This happened when the copper was deposited on the Au surface. The sweep was steadily run for 10 cycles as shown by the overlapping of the 10 traces. As a result, one can find the threshold potential of copper deposition (-0.5 V) and dissolution (2 V) based on the CV curve.
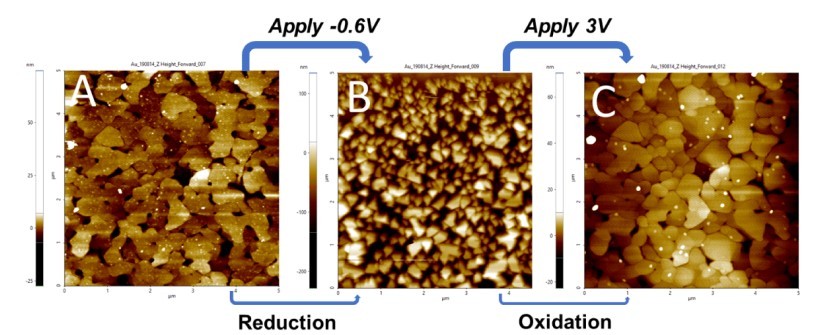
The EC-AFM allows the recording of the topographic changes during electrodeposition/dissolution of materials on the surface. The AFM images in Figure 3 are the topographic images recorded before deposition (Fig. 3A), during deposition (Fig. 3B) and after dissolution of copper (Fig. 3C). As shown in Figure 3A, the bare gold surface with visible terraces was first imaged via AFM. Then the lower limit voltage was constantly applied to the electrode (E = -0.6 V), when a great morphology change showing copper deposition was clearly observed in Figure 3B. The deposition rate increased with time. As the image was scanned from top to bottom, with the time increasing, the deposited copper clusters grew bigger and bigger in size as well. This deposition of copper was reversible. When a higher voltage of 3V was applied for five minutes, the bare Au underneath was again exposed (Figure 3C). All three images were scanned at the same area to confirm the occurrence of copper deposition and dissolution. The Au domains remained the same, as shown by comparing A and C, thus confirming that this electrochemical process is fully reversible.
The in situ dissolution of copper was also monitored with AFM. In the middle of the imaging, positive voltage was applied at the position of the horizontal green dashed line. Tall copper islands (up to 75 nm) dissolved, exposing the bare Au surface (Figure 4). This morphologic change in the middle of the image was clearly characterized via AFM. Likewise, one can also record the in situ deposition using AFM by shifting it to negative voltage.

Figure 3. (A) Pristine Au surface before applying voltage; (B) After applying -0.6V through the potentiostat, the Au surface was covered with copper clusters; (C) the Au surface was re-exposed after applying 3V.

Figure 4. In situ 3D display (A) of the AFM image (B) acquired in 1 mM CuSO4 showing bare Au surface (lower part) exposed after dissolution of electrochemically deposited copper clusters (upper part) at E = 3 V, 5 μm × 2.6 μm, vertical range 200 nm. The corresponding line cursor profile (C) quantifies the height difference between copper and gold regions.
The in situ dissolution of copper was also monitored with AFM. In the middle of the imaging, positive voltage was applied at the position of the horizontal green dashed line. Tall copper islands (up to 75 nm) dissolved, exposing the bare Au surface (Figure 4). This morphologic change in the middle of the image was clearly characterized via AFM. Likewise, one can also record the in situ deposition using AFM by shifting it to negative voltage.
Conclusion
The result of this study demonstrates that an advanced atomic force microscopy system with electrochemical cell can effectively measure electrochemical process in situ. It shows that a Park NX12 EC-AFM with Potentiostat can be set up easily and obtain data from electrochemical reactions in a controlled mechanism. The process of copper deposition is controlled by changing the applied voltage, and it is fully reversible. This experiment shows a lot of promise for the study of nanoscale electrochemical reactions using Park EC-AFM.
References
1. Vidu, R., and Hara, S., Surface alloying at the Cd| Au (100) interface in the upd region. Electrochemical studies and in situ EC-AFM observation. Journal of Electroanalytical Chemistry 475 (2) (1999) 171-180.
2. Crow, D. R. (2017), Principles and Applications of Electrochemistry, Routledge.
3. Reggente, M., Passeri, D., Rossi, M., Tamburri, E., and Terranova, M. L., In Electrochemical atomic force microscopy: In situ monitoring of electrochemical processes. AIP Conference Proceedings, AIP Publishing (2017) 020009.
4. Huang, H. (2017). Electrochemical Application and AFM Characterization of Nanocomposites: Focus on Interphase Properties (PhD Dissertation). Stockholm. Retrieved from http://urn.kb.se/ resolve?urn=urn:nbn:se:kth:diva-203239.
5. Yamaguchi, Y., Shiota, M., Nakayama, Y., Hirai, N., and Hara, S., Combined in situ EC-AFM and CV measurement study on lead electrode for lead–acid batteries. Journal of Power Sources 93 (1-2) (2001) 104-111.
6. Ban, I., Yamaguchi, Y., Nakayama, Y., Hirai, N., and Hara, S., In situ EC-AFM study of effect of lignin on performance of negative electrodes in lead−acid batteries. Journal of Power Sources 107 (2) (2002) 167-172.
7. Vidu, R., Quinlan, F. T., and Stroeve, P., Use of in situ electrochemical atomic force microscopy (EC-AFM) to monitor cathode surface reaction in organic electrolyte. Industrial & Engineering Chemistry Research 41 (25) (2002) 6546-6554.
8. Niu, L., Yin, Y., Guo, W., Lu, M., Qin, R., and Chen, S., Application of scanning electrochemical microscope in the study of corrosion of metals. Journal of Materials Science44 (17) (2009) 4511-4521.
9. Davoodi, A., Pan, J., Leygraf, C., and Norgren, S., In situ investigation of localized corrosion of aluminum alloys in chloride solution using integrated EC-AFM/SECM techniques. Electrochemical and Solid State Letters 8 (6) (2005) B21-B24.
10.Rezaei, B., and Irannejad, N. (2019). Electrochemical detection techniques in biosensor applications. In Ali Ensafi (Ed.) Electrochemical Biosensors (pp 11-43).
