Nanoscience in GeoScience – Nanopore Characterization Using Atomic Force Microscope
- 30 Sep 2020
- Volume 20
- NANOscientific Magazine, Summer 2020
Farzam Javadpour, Ph.D. Bureau of Economic Geology, Jackson School of Geosciences, The University of Texas at Austin

Geoscience is a branch of science dealing with the physical and chemical constitution of the Earth and its atmosphere. Nanoscience is the study of structures and materials on the scale of nanometers. To give you an idea of how small a nanometer (nm) is, a string of hair is about 75,000 nm in diameter and a human red blood cells is about 7,000 nm. Structures at the nanometer scale take on fascinating properties that are normally ignored at larger scale. One intriguing nanostructure present in geological systems is the existence of nanoscale pores—nanopores—in underground shale gas and tight oil reservoirs. These deep geological formations host enormous stores of oil and gas generated over millions of years. Many of these nanopores are interconnected in shale gas and tight oil reservoirs.
These tight reservoirs can produce both natural gas and oil thanks to horizontal drilling and multistage hydraulic fracturing technology. The Darcy equation is a well-accepted equation relating pressure gradient to flux in porous media. In the past few decades, the oil industry has successfully used the Darcy equation for conventional oil and gas reservoirs, which have pores ranging from 10 micrometers to hundreds of micrometers—orders of magnitude larger than the nanopores in shale and tight oil reservoirs. The small size of nanopores makes the Darcy equation inaccurate for modeling gas and liquid flow in such tight systems.
We study and model the transport of water, gas, and oil in shale and tight oil reservoirs. Our research has immediate applications in hydraulic fracturing design to optimize fractureto-fracture spacing and well-to-well spacing. Optimizing the separation space between fractures and wells reduces the cost per barrel, making the development of these strata economically and environmentally feasible. Gas-flow models and oil-flow models are also needed to assess in-place gas and oil, production deliverability, and further production optimization in these reservoirs.

Detecting Nanopores
Pores size and connectivity are important features of any porous material. The mean pore size in conventional oil and gas reservoirs ranges from 10 micrometers to hundreds of micrometers, whereas in unconventional shale gas and tight oil reservoirs, the mean pore size is three orders of magnitude smaller—10 nanometers to hundreds of nanometers. There are two major methods for detecting pores in porous samples: (1) direct pore detection through visualization and (2) indirect methods such as capillary pressure tests using mercury injections [1-2]. Both direct and indirect methods have their own pros and cons. Direct methods can reveal pore geometries and their location among many different mineral types but are limited to a twodimensional planar view and location. Indirect methods provide pore size distribution for the entire sample in three dimensions but lack information about pore geometry and location. Indirect methods are generally more expensive, time consuming, and sometimes destroy the sample, limiting additional testing on the same sample.
Light microscopes have been used to examine thin sections of the rock samples and directly visualize pores in conventional reservoirs. However, the small size of the nanopores in shale gas and tight oil reservoirs make it necessary to use other imaging methods for these samples. Scanning electron microscopy (SEM) [3] and atomic force microscopy (AFM) [4] have recently been used. Both SEM and AFM can detect pores at the nanoscale if a sample with a perfectly flat surface is available.
The study of pore systems in shales took a major leap forward with the introduction of Ar-ion milling as a sample preparation technique to provide a flat sample surface [5]. Examination of Ar-ion-milled surfaces using high field-emission SEM has made it possible to define different pore types on the scale of micro- to nanometers (interparticle, intraparticle, and organic matter) which are common to shales [6]. In particular, numerous types of pores were shown to be developed in different varieties of organic matter (kerogen, bitumen, and pyrobitumen) [7].
One of the early concerns of the SEM technique for detecting nanopores in shale samples was whether the detected nanopores were truly natural pores or in fact the result of high-energy beam emission during SEM imaging. This concern was especially critical because most nanopores were detected in organic materials (Fig. 1), which are possibly sensitive to high-energy beams. Therefore, although SEM detection of these pores was an exciting and an important development, a second method was needed to validate the existence of nanopores in shale. We used atomic force microscopy (AFM) to detect the nanopores and confirm that many of the nanopores detected by SEM occurred naturally [4].
An atomic force microscope—one of a family of scanning probe microscopes widely used to study biological systems and material science—can directly measure the interactive forces between surfaces or molecules. AFM can be used to measure the topography of surfaces and examine the geometry and size of pores at the nanoscale. It can also be used to measure surface forces such as van der Waals (vdW) and the electrostatic forces between molecules of interest and mineral rocks.
AFM uses a flexible cantilever which acts as a spring to determine the net force between a coating at the tip of the cantilever and a sample. Local attractive and repulsive forces between the tip and the sample material basically bend the cantilever arm. The proximal end of the cantilever is attached to a rigid base that allows vertical movement with piezoelectric materials (Fig. 2). The movement of the cantilever is detected and converted into an electrical signal to produce force curves versus distance. The detection system that has become the standard uses a focused laser beam that is reflected from the rear of the cantilever onto a detector. Using the optical lever principle, a small displacement of the cantilever is converted into a measurably large deflection in the position of the reflected spot on a photodetector (Fig. 2).
Most atomic force microscopes use a photodiode divided into four quadrants, which enables the localized laser spot to be determined in two dimensions. Signals from these four quadrants are compared to determine the deflection signal. Vertical deflection can be calculated by comparing the spot location between the top and bottom halves of the detector. Lateral twisting of the cantilever can also be calculated by comparing the spot location on the left and right halves of the detector. Figure 3 shows the surface topography of a 4.0 × 4.0 × 0.6-µm area of a shale sample measured with AFM. It is one of the first AFM images of a shale sample scanned in the NanoGeosciences Laboratory at the Bureau of Economic Geology (Jackson School of Geosciences, The University of Texas at Austin).
Detecting pores and determining their connectivity helps us to understand the movement of different fluid molecules through porous strata and to determine permeability. Permeability [8] is a useful macroscopic parameter that tells us how much of the in situ oil and gas is recoverable. It is a critical parameter to helping companies assess plays for investment and budget for development. It can be used in many field applications such as designing processes for hydraulic fracturing. Hydraulic fracturing is an expensive process that uses huge amount of water; therefore, any improvement in the accuracy of its application is environmentally and economically attractive.
In addition to using AFM to detect nanopores on surfaces, we also use AFM to measure force spectroscopy between fluid molecules and pore wall materials. These measurements are necessary to determine parameters such as liquid slip length in liquid-flow models. In the next section, we present brief discussions on gas and liquid flow in the nanopores of shale gas and tight oil reservoirs. Later, we describe the digital techniques used to generate three-dimensional digital models of shale to determine permeability. We conclude by discussing the application of these measurements and modeling efforts in hydraulic fracturing design and production forecast models necessary for field investment and development.
Single-Phase Gas Flow Model
Gas flow in nanopores deviates from the Darcy equation through the life of a well in shale gas reservoirs. Early in a well’s life, when the reservoir pressure is high, gas flow may follow the Darcy equation; however, when reservoir pressure is declined, it may deviate from Darcy equation. The Knudsen number is a criterion that can be used to determine whether the Darcy equation is valid:
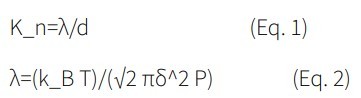
In which λ is mean free path, d is average pore size, kB is the Boltzmann constant, δ is gas molecule size, and T and P are temperature and pressure, respectively. Figure 4 shows different flow regimes as a function of the Knudsen number and the validity of the Darcy equation as a function of the Knudsen number.
Javadpour (2009) [8] proposed superimposing Brown’s gas-slip flow and Knudsen diffusion to create a general form of gas-flow model for shale gas reservoirs. This is possible because these two processes may not act simultaneously during the life of a well. Early in the life of a reservoir (or well) pressure is high and Knudsen diffusion is negligible, so it is possible for gas slip to be the dominant process, even for systems with extremely small pores. Gas-slip dominance continues until pressure drops below about 600 psi. At 600 psi, operators usually abandon the well. So, in practice, gas slip is the main contributing process in the field. Although shale reservoirs do not operate at pressures lower than 600 psi, modeling gas flow at lower pressures is necessary for bench experimentation, e.g., GRI and pulse-decay permeability tests [9].It is easier to run tests at low pressures, and the proposed model can then be used to correct the experimental permeability data for the Knudsen diffusion effects.
The most recent models are built upon the earlier model8 with some modifications to account for the flow of real gas in porous media and surface roughness [10-13].
An easy way to show the difference between the Darcy permeability model and our proposed model—hereinafter called apparent permeability—is to plot the ratio of apparent permeability to Darcy permeability. The ratio of apparent permeability (kapp) to Darcy permeability (kD) for the models proposed is given by Equation 3:
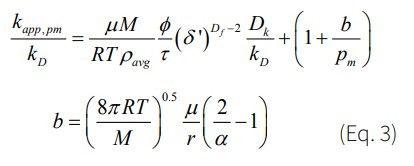
in which µ, M, and ρ are viscosity, molar mass, and density of gas at average reservoir pressure pm, respectively. R is the gas constant, T is absolute temperature, r is average pore size, ϕ is porosity, τ is tortuosity, Df is fractal dimension, δ’ is the ratio of normalized gas molecule size to local average pore size, and α is the tangential momentum accommodation coefficient (TMAC). Equation 3 shows that permeability is pressure-dependent, assuming Knudsen diffusion and slip flow (the “Klinkenberg effect”) are the main mechanisms of the overall flow in shale gas reservoirs. Figure 5 shows apparent permeability as a function of pressure in a shale system with different average pore sizes. The TMAC is the only parameter in Equation 3 that was not readily available for shale samples. TMAC depends on gas molecule type and the material of the pore wall. Singh and Javadpour (2015) [11] developed a method to determine TMAC from gas desorption tests conducted on shale samples. Gas desorption is a routine test that most companies run on their shale samples.
Single-Phase Liquid Flow Model
The leak-off of hydraulic fracturing fluid into the matrix and the production of oil and water from shale gas and tight oil reservoirs are examples of liquid transport in these systems. In most engineering applications, it is valid to assume no-slip boundary conditions; however, when dealing with nanopores, liquid slippage on pore walls is not negligible and needs to be included in flow models [14].Various authors have come up with diverse ways of estimating liquid slippage based on theoretical [15-16] and semi-empirical models [16-17]. Recently, molecular dynamics simulations [18-19] and lattice Boltzmann methods [20] have also been used to study liquid flow in nanoporous shale and tight oil systems. We developed an AFM metrology to measure liquid slip length for the leakoff of fracturing fluid in shale-gas and tight-oil reservoirs [14]. Please note that although gas slippage and liquid slippage are similar processes for describing gas and liquid slippage in pores, the methods to determine gas slippage and liquid slippage are different. Liquid slip length depends on fluid type, pore-wall material, and flow rate. Vinogradova (1995) [21] made a theoretical study of the drainage of a thin liquid film between two undeformable surfaces. She suggested that the slippage is probably linked to the decrease in viscosity of the thin layer near the wall. Under equivalent conditions, the liquid slip length within a pore and over an object (e.g., a spherical particle) is the same. However, measuring liquid slip length over an object is easier. Therefore, we use spherical particles and flat substrate of a similar material to the pores in shale to measure liquid slip length. The measured liquid slip length will be used in digital shale models to determine effective liquid permeability corrected for the liquid slip length.
The force acting on a sphere with radius R1 approaching another sphere with radius R2 is defined as:
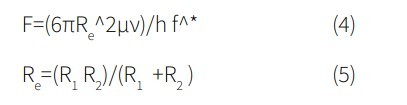
in which h is the separation distance between the surfaces of two hydrophobic spheres and f* is the slippage correction factor for approaching spheres, with relative velocity of ν in a liquid with viscosity µ. 21
For the limiting case of R2→∞, Re→R1, the solution can be used for a hydrophobic sphere approaching a hydrophobic flat surface.
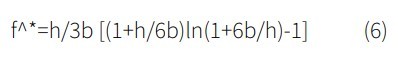
Figure 6 illustrates an AFM setup with a spherical particle attached to the cantilever that approaches a flat substrate. Cantilever deflection versus separation distance between the particle and the substrate was measured and later converted into acting force on the particle as a function of separation distance using Hooke’s law (Fig. 7). Liquid slip length can be determined by fitting Equation 6 to force-distance experimental data.
Digital Realization of Nanoporous Shale
Direct measurement of permeability in shale and tight oil samples is not an easy task. Current measuring techniques are expensive, time-consuming, and still evolving. We use digital realizations as an alternate approach to obtaining permeability values from more reliable and readily available measuring data such as porosity, pore-size distribution, and mineralogy [22]. In addition, permeability in shale is not only a rock characteristic; it also depends on fluid types, pressure, temperature, and pressure gradient. Therefore, a model that predicts different fluid type (oil, gas, water) and different pressure and pressure gradient conditions can save time and costs. Characterization of shale samples, which are typically low permeability, is very difficult due to the presence of multiscale structures. Though threedimensional (3D) imaging can be an ultimate solution for revealing important complexities of such samples, acquiring these images is impractical due to the cost and processing time. On the other hand, high-quality two-dimensional (2D) images, which are widely available, also reveal useful information about organicmatter distribution, associated pores in organic and inorganic matter, and pore connectivity. The objective is to construct 3D digital images from 2D SEM or AFM images and then perform fluid-flow modeling to gain understanding of fluid flow and permeability in 3D blocks of shale samples. We have used different reconstruction approaches, such as imaged-based and object-based models (Fig. 8), to determine effective gas and liquid permeability in shale and tight oil systems [23-26]. The resultant effective gas and liquid permeability can then be used in fluid-flow simulations or hydraulic-fracturing design.
Application to Hydraulic Fracturing
The distance between horizontal wells and the separation distance between aspects of any unconventional shale gas or tight oil reservoir development (Fig. 9). The reservoir becomes overstimulated if the wells are too close to each other or if the separation distance between fracturing stages is too close. Overstimulation is costly and increases the cost per barrel. However, if the wells are too far apart or the hydraulicfracturing separation distance is too far, then a significant portion of the reservoir remains unstimulated, which also increases the cost per barrel. Effective liquid permeability is needed to optimize hydraulic-fracturing design in terms of well-to-well distance and fracture-tofracture-distance. Figure 10 highlights the importance of effective liquid permeability on hydraulic-fracturing design. Underestimated liquid permeability results in overestimation of induced fracture networks. Hence, wells will be drilled too far apart, and the fracture spacing between fracture stages will also be too far apart [14].A proper fracturing design is cost effective with minimum environmental impacts.
Application to Production Decline Forecasts
Matrix permeability, the network of induced fractures, and their properties control pressure propagation and fluid flow in hydraulically fractured shale and tight oil reservoirs. We developed a novel, fully fractal model in which both the spacing and the porosity/ permeability of induced fractures are distributed based on fractal dimensions, i.e., fractal decay of fracture density and the associated porosity/permeability away from the main induced fracture [27]. The fractal fracture distribution is general —that is, it handles exponential, linear, power, and uniform distributions. We also developed a new, fully fractal diffusivity equation based on the fractal distribution of fractures and their properties. Then, for the first time, we used the semianalytic Bessel spline scheme to solve the developed diffusivity equation. Our proposed model [27] is general and can capture any form of inducedfracture distribution for better analysis of pressure response and production rates at transient and pseudo-steadystate conditions. We used these models to match and predict production data from a multifractured horizontal gas well in the Barnett Shale (Fig. 11). Our results showed the importance of estimated matrix permeability to improve matching field data.
References
(1) Javadpour, F.; Fisher, D.; Unsworth, M., Nano-scale Gas flow in shale sediments. Journal of Canadian Petroleum Technology 2007, 46(10), 55–61.
(2) Wang, S.; Javadpour, F.; Qihong, F., Confinement Correction to Mercury Intrusion Capillary Pressure of Shale Nanopores. Scientific Reports 2016, Feb. 1, 6:20160, 1-11.
(3) Reed, R. M.; Sivil, J. E.; Sun, X.; Ruppel, S. C., Heterogeneity of Microscale Lithology and Pore Systems in an Upper Cretaceous Eagle Ford Group Horizontal Core, South Texas, USA. GCAGS Journal 2019, 8, 22–34.
(4) Javadpour, F.; Moravvej, M.; Amrein, M., Atomic Force Microscopy (AFM) A New Tool for Gas Shale Characterization. Journal of Canadian Petroleum Technology 2012, 51(4), 236‒243.
(5) Loucks, R. G.; Reed, R. M.; Ruppel, S. C., Jarvie, D. M., Morphology, Genesis, and Distribution of Nanometer-scale Pores in Siliceous Mudstones of the Mississippian Barnett Shale: Journal of Sedimentary Research 2009, 79, 848–861.
(6) Loucks, R. G.; Reed, R. M.; Ruppel, S. C., Hammes, U., Spectrum of Pore Types and Networks in Mudrocks and a Descriptive Classification for Matrix-related Mudrock Pores. American Association of Petroleum Geologists Bulletin 2012, 96(6), 1071‒1098.
(7) Reed, R. M.; Loucks, R. G., Ko, L. T., Scanning Electron Microscope Petrographic Differentiation among Different Types of Pores Associated with Organic Matter in Mudrocks. GCAGS Journal 2020, v. 9. To appear in October issue.
(8) Javadpour, F., Nanopores and Apparent Permeability of Gas Flow in Mudrocks (Shales and Siltstone). Journal of Canadian Petroleum Technology 2009, 48 (8), 16–21.
(9) Javadpour, F.; Ettehadtavakkoli, A., 2015, Book chapter, Chapter 11: Fluid Flow Processes in Shales. (Book: Fundamentals of Gas Shale Reservoirs; Editor: Reza Rezaee, Publisher: John Wiley and Sons Inc., ISBN 9781- 118-64579-6 hardback).
(10) Darabi, H.; Ettehad, A.; Javadpour, F.; Sepehrnoori, K., Gas Flow in Ultra-tight Shale Strata. Journal of Fluid Mechanics 2012, 710, 641-658
(11) Singh, H.; Javadpour, F., Langmuir Slip-Langmuir Sorption Permeability Model of Shale. Fuel 2015, 164, 28-37.
(12) Afsharpoor, A.; Javadpour, F., Liquid Slip Flow in a Network of Shale Noncircular Nanopores. Fuel 2016, 180, 580-590.
(13) Wang, S.; Qihong F.; Javadpour, F.; Zha, M.; Cui, R., Multiscale Modeling of Shale Apparent Permeability: An Integrated Study of Molecular Dynamics and Rigid Pore Network Model. SPE Journal 2020. Available online.
(14) Javadpour, F.; McClure, M.; Naraghi, M.E., Slipcorrected Liquid Permeability and its Effect on Hydraulic Fracturing and Fluid Loss in Shale. Fuel 2015, 160, 549-559.
(15) Philip J. R., Flows Satisfying Mixed No-slip and Noshear Conditions. Zeitschrift für angewandte Mathematik und Physik 1972, 23, 353–372. (16) Lauga E; Stone H., Effective Slip in Pressure Driven Stokes Flow. Journal of Fluid Mechanics 2003, 489, 55–77.
(17) Ou J.; Perot B.; Rothstein J. P., Laminar Drag Reduction in Micro Channels Using Ultrahydrophobic surfaces. Physics of Fluids 2004, 16(12), 4635–4643.
(18) Wang, S.; Javadpour, F.; Qihong, F., Fast Mass Transport of Oil and Supercritical Carbon Dioxide Through Organic Nanopores in Shale, Fuel 2016, 181, 741-758.
(19) Wang, S.; Javadpour, F.; Qihong, F., Molecular Dynamics Simulation of Oil Transport Through Inorganic Nanopores of Shale. Fuel 2016, 171, 74-86.
(20) Zhang, T.; Javadpour, F.; Yin, Y.; Li, X., Upscaling Water Flow in Composite Nanoporous Shale Matrix Using Lattice Boltzmann Method. Water Resources Research 2020. DOI:10.1029/2019WR026007. Available online.
(21) Vinogradova, O.I., Drainage of a Thin Liquid Film Confined between Hydrophobic Surfaces. Langmuir 1995, 11, 2213–2220.
(22) Naraghi, M.E.; Javadpour, F.; Ko, T.K, An Object-based Shale Permeability Model: Non-Darcy Gas Flow, Sorption, and Surface Diffusion Effects. Transport in Porous Media 2018, 125, 23-39.
(23) Tahmasebi, P.; Javadpour, F.; Sahimi, M., Multiscale and Multiresolution Modeling of Shales and their Flow and Morphological Properties. Scientific Reports 2015a, 5:16373, 1-11. (24) Tahmasebi, P.; Javadpour, F.; Sahimi, M., Three Dimensional Stochastic Characterization of Shale SEM Images. Transport in Porous Media 2015b, 110, 521-531.
(25) Tahmasebi, P.; Javadpour, F.; Sahimi, M., Multiscale Study for Stochastic Characterization of Shale Samples. Advances in Water Resources 2016a, 89, 91-103.
(26) Tahmasebi, P.; Javadpour, F.; Sahimi, M., Stochastic Shale Permeability Matching: Three-Dimensional Characterization and Modeling, International Journal of Coal Geology 2016b, 165, 231-242.
(27) Sheng, G.; Javadpour, F.; Su, Y.; Liu, J.; Li, K.; Wang, W., A Semianalytic Solution for Temporal Pressure and Production