Park Pinpoint™ Mode For Cell Biology
- 01 May 2015
- Volume 4
- NanoScientific Magazine, Spring 2015

Bio-application Scientist
PinPoint Mode Enables Surface Nanomechanical Property Imaging
In addition to nano-scale three dimensional imaging, nano-mechanical property measurement is one the most popular functions of atomic force microscopy (AFM). The basic AFM mode for nano-mechanical property measurement is force-distance (FD) spectroscopy. FD spectroscopy measures the physical properties of the sample surface, such as its hardness, adhesion, etc. by using nano-size cantilever tip to push the sample in the range of nN-scale. Nano-mechanical property characterization at the nN-scale is possible only with the AFM therefore it is widely used in material science, physics, chemistry, etc. for various nano level research. FD spectroscopy is also popular in biological research because it is the only technique available which can physically measure the single molecular binding force. Recently, new application of FD spectroscopy is being developed which is the study of comparing physical properties of a single cell or a tissue with various functions or diseases to make a diagnosis.
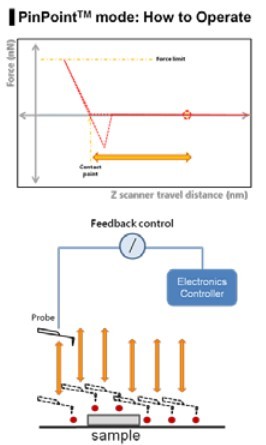
Figure 1. The PinPoint mode operation principle and the scheme.
In order to analyze the physical properties of a single cell in accordance with the biological functions, FD spectroscopy should be aligned exactly with the topographical data. In general, the topography of a sample is acquired first and FD spectroscopy is performed on the specific position using topographical data as a reference map. AC AFM mode (dynamic or tapping mode) is generally used to minimize the AFM artifact from sample-tip interaction in biological sample imaging. However, it is very difficult to avoid the positional errors correlating topographical data and FD spectroscopy data because the soft and sticky nature of the biological samples introduce unavoidable various AFM artifacts even during AC mode. The PinPoint mode was newly developed to compensate the positional errors between topographical and FD data. The PinPoint mode does this by its capability to simultaneously acquire topographical data and the FD data at each pixel, as shown in Fig 1. There is a significant difference from the conventional AFM imaging of the raster scan with Z scanner feedback. In the PinPoint mode operation, the cantilever approaches at each pixel in the entire scan area (for example 256x256 pixel = 65536 points) to acquire the height of the sample surface to generate 3D topographical image of the sample and FD spectroscopy information at the same time. By lifting the cantilever tip perpendicularly from the sample surface at every pixel, it provides extra clearance space when the cantilever tip moves to the next pixel position during the PinPoint mode as shown in Fig. 2. Even if there is an adhesive interaction between the sample surface and the cantilever tip at the previous point (Pixel a) that connection is completely removed before arrival at the next pixel point (Pixel a+1), hence an accurate topographical information is obtained and the tip-sample interaction information at each pixel can be saved.
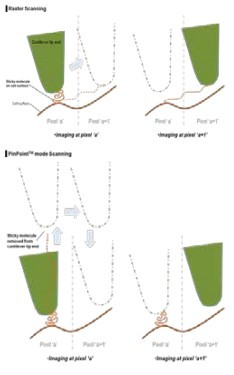
Figure 2. Raster vs. PinPoint Mode Scanning
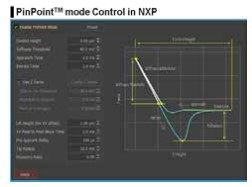
Figure 3. The user interface for the PinPoint mode operation in the NXP software
and its control parameters.
This is the biggest advantage of the PinPoint mode, in that simultaneous acquisition of height and FD data guarantees the accuracy of correlating between two types of information. PinPoint mode operation can be controlled by users using preset parameters shown on the left column of Fig. 3. The preset parameters include such as the control height, the stiffness threshold for topographical and FD data, the approach and retract time, the lift height, the XY pixel to pixel move time, and the pre-approach delay for determining a scanning speed, etc. The important preset parameters to be determined carefully are the stiffness threshold and the control height. The AFM cantilever presses on the sample surface repeatedly with certain amount of force determined by the stiffness threshold. In order to obtain accurate FD spectroscopy data, the stiffness threshold should be determined carefully. The control height determines the retraction height during movement between pixels after cantilever pushes away from the sample surface. The control height is the most delicate parameter to control because it greatly depends on the type of sample surface characteristic. Generally speaking, smaller number can be used for smaller step height and bigger number for bigger step height. However, in the case of a sample with sticky surface the control height should be appropriately increased in order to clearly disconnect the tip-sample interaction before moving to the next pixel, even if the step height is small. The three physical properties which can be obtained simultaneously through PinPoint mode are the surface morphology, elasticity map, and adhesion force map.
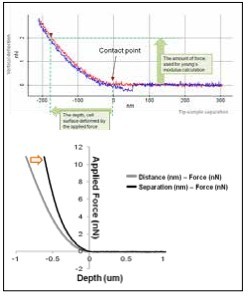
Figure 4. Force-Distance curve generated by the PinPoint mode
a. Surface Morphology (Height)
The height information constituting the morphology of the sample surface is determined when the designated stiffness threshold is reached. In other words, the Z detector records how much Z scanner is extended when the certain cantilever deflection, determined by preset stiffness threshold, is reached. The level of cantilever deflection can be accurately designated in the NXP software from Park Systems for optimized surface morphology.
b. Elasticity (Stiffness)
The elasticity (stiffness) at the certain position of sample surface can be obtained by the same way in the FD spectroscopy. The stiffness can be obtained from the slope of FD curve from contact point to deflection threshold generated during the PinPoint mode operation. Applying Hertz model, designed for soft and elastic samples, user can calculate elasticity (Young's modulus) from the slop, too. In order to calculate Young's modulus using Hertz model equation, FD curve should be converted to tip-sample separation curve to determine the deformation depth from the sample surface. (Fig. 4) For the accurate measurement of the Young's modulus, the accurate positioning to determine the contact point with cantilever tip is very important. The data processing algorithm of NXP automatically generate a Young's modulus image map from the PinPoint mode operation.

Figure 5. The calculation of the adhesion energy
c. Adhesion
In addition to the elasticity map, the adhesion map also can be generated by using PinPoint mode imaging. The adhesion image is generated based on the maximum adhesion force value. The total adhesion energy at each pixel also can be obtained by measuring green area in Fig. 5.
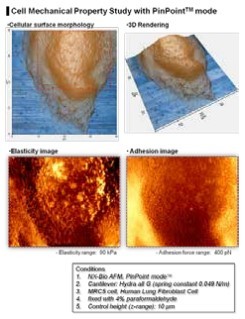
Figure 6. The elasticity and the adhesion map of a MRC5 cell generated by PinPoint mode
Application
As shown in Fig. 6, the elasticity and the adhesion map of a single MRC5 cell was obtained one 3D topographical image at the same time on the NX-Bio using PinPoint mode. The coloring of each pixel representing the elasticity and the adhesion map was determined from the calculation generated by PinPoint FD curve at each pixel. 3D topography shows exact positional match with the FD spectroscopy maps. The higher elastic property can be noted on the nucleus compared to its surrounding areas. The absence of AFM artifacts, such as scratch or streak marks which can be seen frequently in imaging a cell or biological samples in liquid, is an additional benefit of PinPoint mode.
BRIAN CHOI IS BIO-APPLICATION SCIENTIST AND BIOPRODUCT MANAGER AT PARK SYSTEMS. AFTER MAJORING IN BIOLOGY/BIOTECHNOLOGY, HE HAS WORKED AT PARK SYSTEMS FOR 6 YEARS. HE HAS VARIOUS EXPERIENCES ABOUT BIO-AFM MEASUREMENT SUCH AS CELL, SINGLE MOLECULE, TISSUE. HE IS FOCUSING ON DEVELOPING AND INTRODUCING PRACTICAL APPLICATIONS OF NANOMICROSCOPIES(AFM AND SICM) FOR BIOLOGY RESEARCH.
Can cell analysis be done using PinPoint that will help with research on cancer cells?
Researchers have been trying to study cancer by using Atomic Force Microscope (AFM) since its introduction. In order to study cancer at the fundamental level, cancer cell’s physical properties (morphology and stiffness/ elasticity/adhesion force) must be able to measured accurately. For instance, many previous studies about cancer cell diagnosis with AFM have shown that cancer cells are less stiff than normal cells. More importantly, the measured data (cell morphology and stiffness/elasticity/adhesion force) should be distinguishable between cancer cell and normal cell. Conventional AFM imaging method (AC mode, contact mode) for cell (normal or cancer) could not fulfill such technical requirements due to the lack of accurate feedback control in liquid conditions. Even for cancer cells, it is more difficult because of the higher liquidity than normal cells. After obtaining cell morphology, nanomechanical properties (stiffness/elasticity/adhesion force) were acquired by forcedistance spectroscopy on the specific position of cells using the inaccurate morphology data as a reference map. In this process, it is difficult to avoid the positional errors correlating morphological data and nanomechanical data. PinPoint mode solves these problematic issues by: a. acquiring cell morphology more accurately than before with reliable and repeatable quality. b. obtaining nanomechanical properties (stiffness/elasticity/ adhesion force as an image) simultaneously.
Can PinPoint be used in any type of medical applications that are new ways to examine cells and give us more information about them?
Adhesion force imaging of PinPoint mode will allow us to detect the real existence of specific protein, being expressed on the membrane of cancer cell. For example, using functionalized AFM tip, the real time monitoring of ligand-receptor chemical interaction on cancer cell would be a good medical application with PinPoint mode AFM. This application will help to elucidate immunohistochemical analysis for cancer research by identifying various cancer specific protein expression directly on cell membrane and cancer tissue sections.
What types of new advancements like PinPoint can we expect to see to help with Cell Analysis at the nanoscale level in the future?
For cell analysis and study, knowing and observing what’s happening in cell at nanocale is important.Yet, most researchers use AFM for this purpose. However, AFM is a contact-based imaging microscopy,Thus, it gives external physical stimulus to cell which is the main reason, live cell study is not possible to be a routine study for AFM. Even PinPoint mode allows us to accurately control the applying force on cell and minimize it during imaging, the feedback signal comes from AFM tip-contact even against cell surface. In the near future, such all cell studies should be done in non-contact status,from which live cell is not influenced by any external physical stimulus thus the live cell keep expressing its nature during imaging by microscope. To fulfill this requirement, Park SICM (Scanning Ion Conductance Microscopy) has developed and equipped in NX-Bio system. SICM provides the non-contact based cell imaging in liquid conditions, resulting in discovering more detail cell surface features for all cell types, even for tissue.
We expect that Park SICM would have various applications such as nanomechanical property and electrochemical property in the future.